GUIDE
Twitter Competitor Analysis in 2026: Build the Dashboard or Buy Rival IQ
Nine of the ten pages ranking for this are dashboards selling you the answer. We show the calls that produce the metrics, price both sides, and find the crossover.
Per our own spec, 65 of 113 endpoints bill $0.0008, 24 are free, and 24 sit between $0.0016 and $0.01. Every price ships inside our published OpenAPI document as an x-cost-usd field, so any figure in this post can be checked against the contract that bills it rather than taken on trust.

TL;DR: Tracking 5 competitors daily costs about $2.64 a month in API calls, computed from a per-call price we read out of the biller rather than a marketing page. Tracking 50 costs about $4.80, because the expensive measurement is category-wide and does not scale with competitor count. A category dashboard starts around $200 a month. That gap is real, and it is also not the whole decision: below roughly 10 competitors the subscription is buying you engineering time you probably should not spend. Here are the actual calls, the actual arithmetic, and where each side genuinely wins.
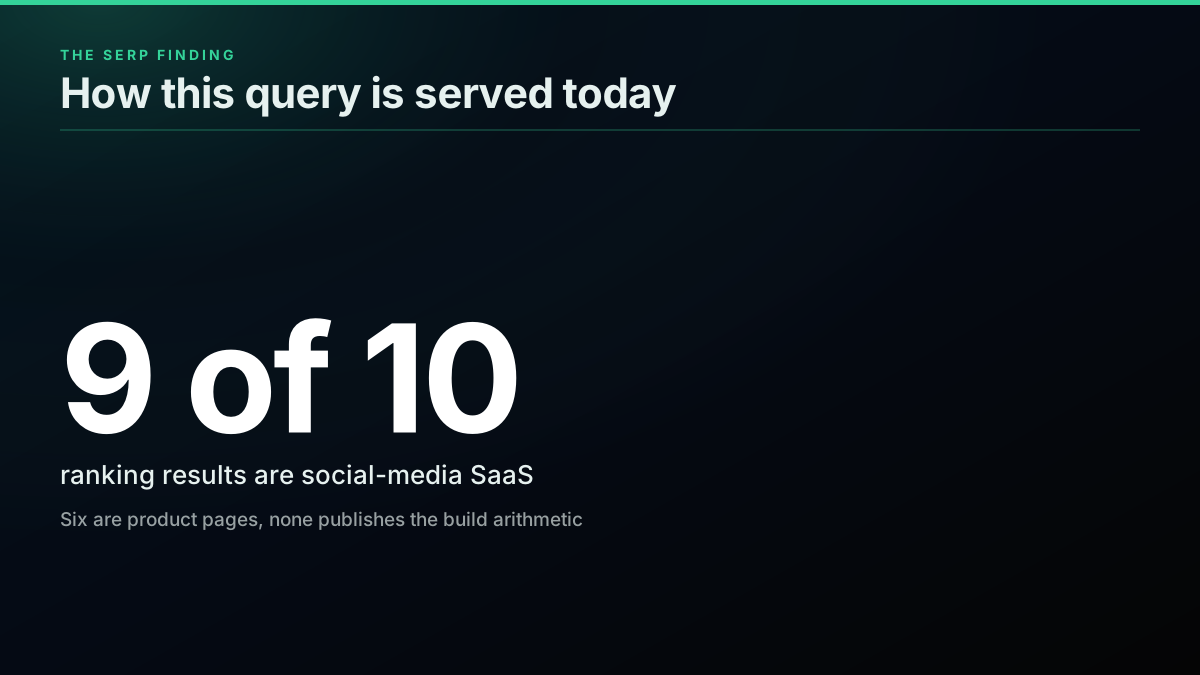
Search for how to do Twitter competitor analysis and you get ten results from ten domains. Nine are social-media-management SaaS.
Six of those nine are product pages. The other three are guides that explain what to track, describe a method, and stop at exactly the point where implementation would start, then link to a subscription. That is not laziness. A vendor cannot publish the build-it-yourself arithmetic without arguing against its own price.
So the comparison the buyer actually wants does not exist on page one. This post is that comparison.
What "competitor analysis" actually decomposes into
The guides treat this as one purchase. It is four separate measurements, and they cost different amounts.
Posting cadence. How often each competitor posts, and when. Cheapest of the four: one timeline pull per competitor per period.
Engagement rate. Likes, reposts and replies per post, normalised by follower count. Same timeline pull, plus a profile read for the denominator.
Share of voice. What fraction of conversation about your category mentions each player. This is the expensive one, because it is a search across the whole category rather than a per-competitor pull.
Follower velocity. Rate of change of follower count. Cheap per reading, but it only means anything as a time series, so its cost is a function of how long you have been collecting.
Conflating these is why nobody prices the job. Cadence for 5 competitors and share of voice across a whole category differ by more than an order of magnitude.
The measured inputs
Two numbers drive everything below, and both carry their source.
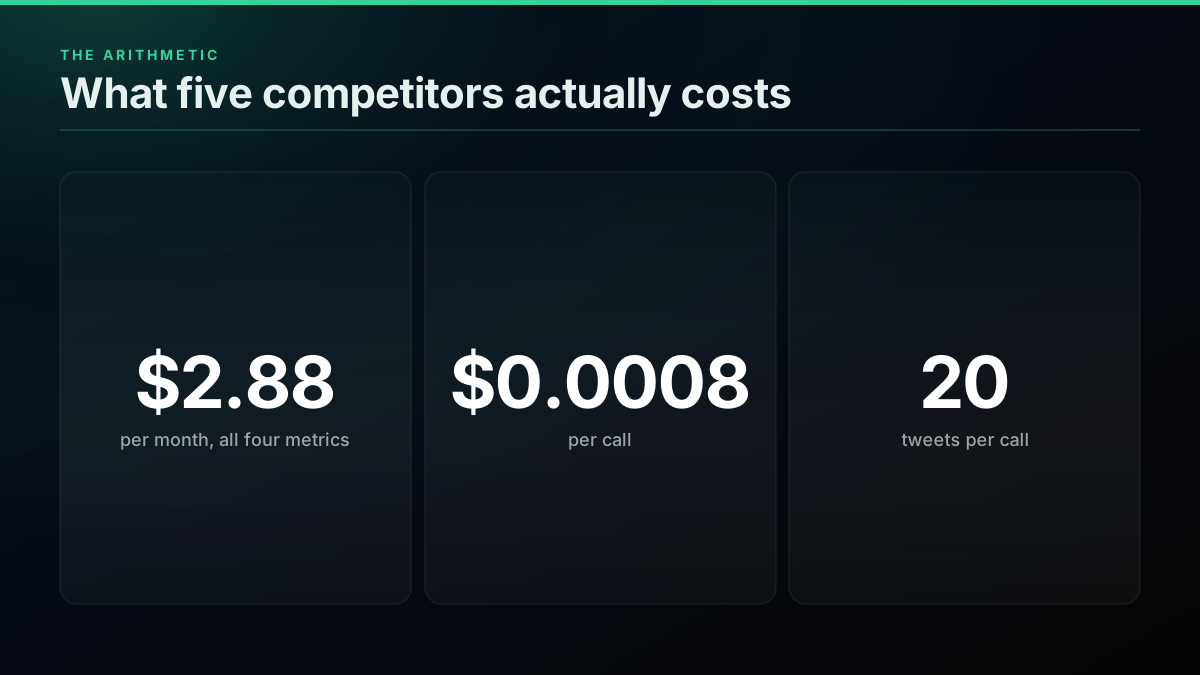
$0.0008 per call, for tweet/advanced_search. MEASURED, read from the biller's own endpoint-costs.json, which is the file the billing system consults at charge time, not a pricing page that may have drifted from it.
20 tweets per call. The published API reference says "roughly 20". Roughly is not a basis for a cost model, so we ran one and counted:
{ "query": "\"machine learning\" lang:en", "product": "Latest",
  "count": 20, "tweets": [ /* 20 items */ ], "has_more": true }
MEASURED, one live call, 2026-08-31.
Everything from here is arithmetic on those two figures, shown rather than asserted.
Costing the build
Posting cadence and engagement, 5 competitors, daily
One timeline pull per competitor per day. A competitor posting under 20 times a day fits in a single call.
5 competitors x 1 call/day x 30 days = 150 calls
150 x $0.0008                        = $0.12/month
Twelve cents. That is the number nine ranking pages decline to print.
Share of voice, the expensive measurement
Share of voice needs the category conversation, not each competitor's own posts. Say your category term returns roughly 2,000 mentions a day:
2,000 mentions / 20 per call   = 100 calls/day
100 x 30 days                  = 3,000 calls/month
3,000 x $0.0008                = $2.40/month
Twenty times the cadence tracking, and still under three dollars.
The realistic bundle
Cadence plus engagement plus share of voice plus daily follower readings:
5 competitors, daily
  timelines        150 calls
  profiles         150 calls
  share of voice 3,000 calls
  total          3,300 calls  x $0.0008 = $2.64/month

50 competitors, daily
  timelines      1,500 calls
  profiles       1,500 calls
  share of voice 3,000 calls   (unchanged, it is category-wide)
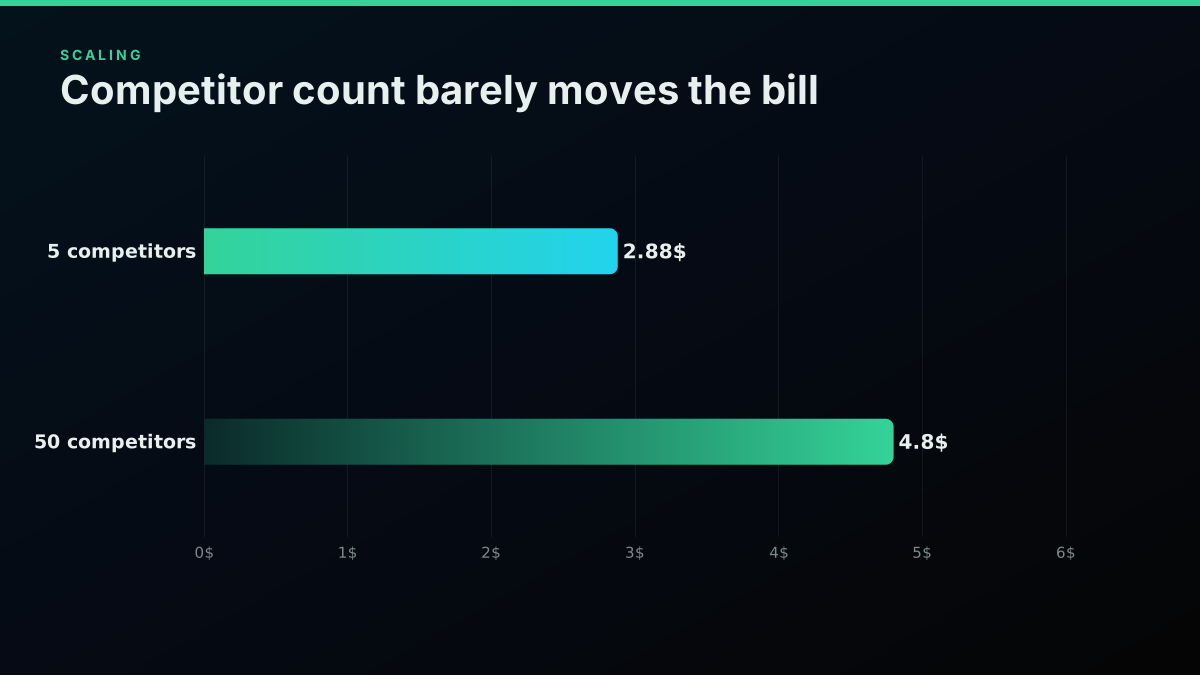
  total          6,000 calls  x $0.0008 = $4.80/month
Note what happens at scale: going from 5 competitors to 50 does not multiply the bill by ten. Share of voice is category-wide and does not move, so the marginal cost of competitor 6 through 50 is only their timelines and profiles. This is the single most useful property of the build, and no subscription page will tell you about it, because per-seat and per-profile pricing does the opposite.
Costing the buy
Category dashboards do not publish a single number either, but they publish enough to bound it. Entry tiers for social competitive-analytics products cluster around $200 a month, rising steeply with tracked profiles, seats and history depth. PUBLISHED, from vendor pricing pages, and worth re-reading at the moment you budget rather than trusting this line: this is the SERP where nine of ten results are vendors, and their prices move.
Against the build:
5 competitors, daily    build $2.64/mo     buy ~$200/mo     75x
50 competitors, daily   build $4.80/mo     buy considerably more, tiers scale on profiles
At which point an honest post has to stop and say what that ratio does and does not mean.
Before committing either way, it is worth seeing how the practitioners who do this daily talk about it. This thread is a useful counterweight to vendor marketing, because the people answering are the ones maintaining the collectors:
https://www.reddit.com/r/socialmedia/comments/1ah8xqz/best_dm_automation_tools/
And for the API mechanics themselves, this walkthrough covers the console steps that change most often:
https://www.youtube.com/watch?v=fHHDM2-If9g
It is also worth knowing what the platform is shipping directly, because it changes what a build has to cover:
https://x.com/XDevelopers/status/2071752389183647758
A hosted MCP surface shifts some of the plumbing a build used to own. It does not answer the competitor-tracking question, but it does shrink the gap between wiring something yourself and reaching for a tool.
Where buying genuinely wins, and it is not a small list
A build-vs-buy post that concludes "always build" is an advertisement. This SERP already has ten of those pointing the other way, and the arithmetic above is only one input.
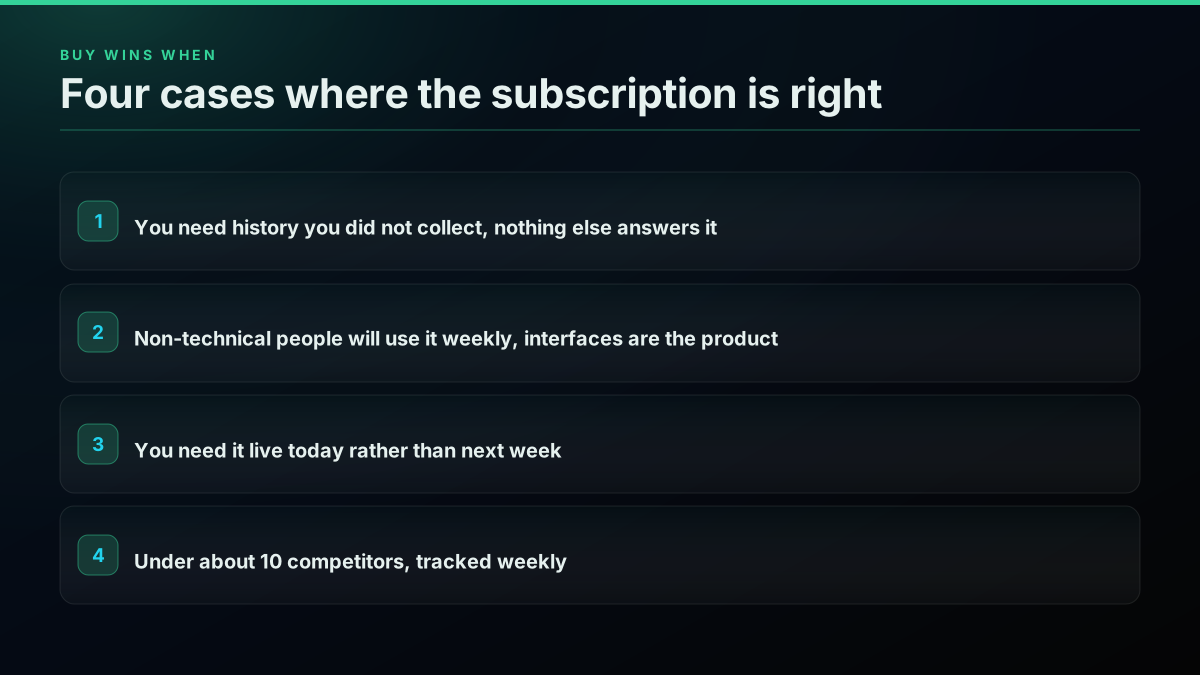
You have no engineering time. The $2.64 is the API bill. It is not the cost of writing the collector, scheduling it, storing the results, handling pagination and rate limits, noticing when a competitor renames their handle, or rebuilding a chart every time somebody asks a new question. If that work displaces something more valuable, $200 a month is cheap.
You need it today. A dashboard is live in an afternoon. A build is live in a week if nothing surprises you, and something usually does.
Non-technical people need to use it. This is the one most build-side arguments skip. A dashboard has an interface, permissions, scheduled email reports and a shareable link. A cron job writing rows has none of those, and building them is a second project larger than the first.
You need historical data you did not collect. This is the hardest one to argue past. A vendor tracking your category since 2023 can show you a two-year trend on day one. A build starts accumulating history the day you turn it on, and no amount of API budget buys back the months you did not collect. If the question is "how has share of voice moved since last year", buying is not merely easier, it is the only option that answers it.
Under about 10 competitors, tracked weekly. The build's advantage compounds with scale, and at small scale it is mostly the setup cost with little to amortise it against.
Where building wins
Above roughly 50 competitors. Per-profile pricing punishes exactly the case where the marginal API cost is near zero, since share of voice is category-wide and does not move.
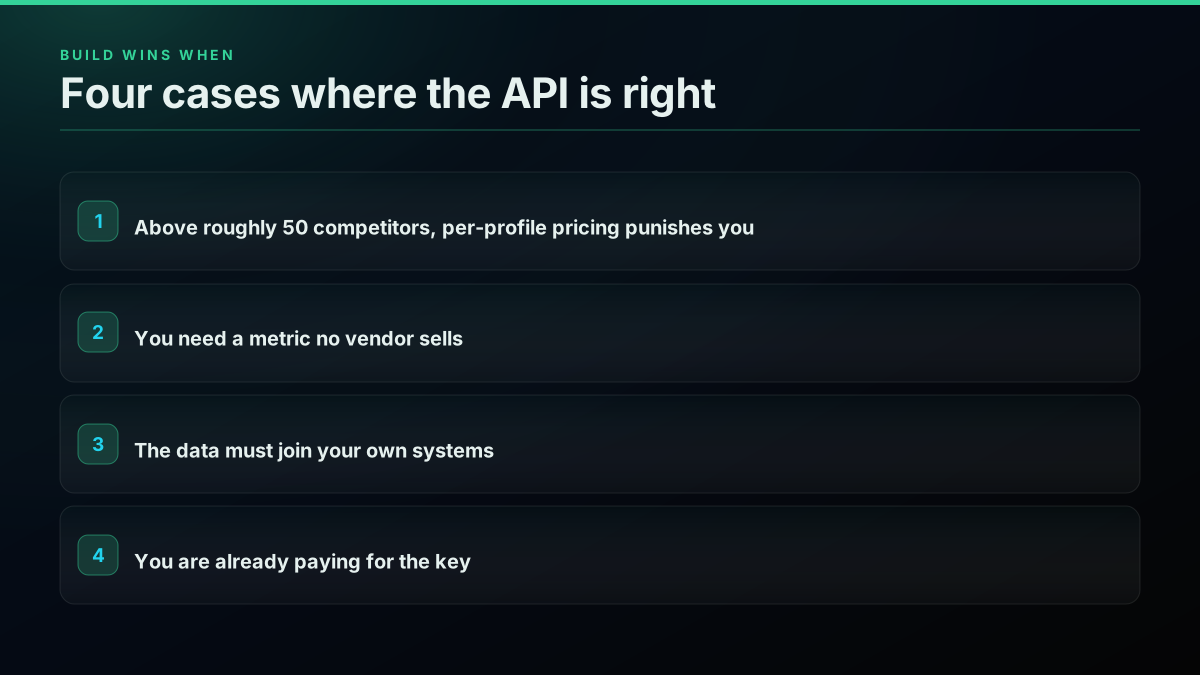
When you need a metric nobody sells. Every dashboard computes the metrics its vendor chose. If your question is "which of my competitors' posts get replies from accounts that also follow me", no product has that button, and the API answers it in a loop.
When the data has to join something else. Competitor posting cadence against your own deploy log, your support ticket volume, or your pipeline. A dashboard is a walled garden by design; a table in your warehouse joins to anything.
When you are already paying for the API. If a metered key exists for another job, the marginal cost of competitor tracking is the $2.64 above and nothing else, which changes the arithmetic completely.
Start building with TwitterAPIs
$0.0008 a call, about $0.04 per 1,000 tweets at 20 tweets a page. $0.50 free credits. No credit card required.
The calls, concretely
Enough theory. This is the whole collector for cadence and engagement.
import os, requests, collections

KEY  = os.environ["TWITTERAPIS_KEY"]
BASE = "https://api.twitterapis.com/twitter"
COMPETITORS = ["competitor_a", "competitor_b", "competitor_c"]

def timeline(handle, pages=1):
    out, cursor = [], None
    for _ in range(pages):
        r = requests.get(f"{BASE}/user/tweets",
                         headers={"x-api-key": KEY},
                         params={"userName": handle, "cursor": cursor},
                         timeout=30)
        r.raise_for_status()
        page = r.json()
        out += page.get("tweets", [])
        cursor = page.get("next_cursor")
        if not page.get("has_more"):
            break
    return out

rows = []
for h in COMPETITORS:
    tweets = timeline(h)
    if not tweets:
        continue
    eng = sum((t.get("favorite_count") or 0) + (t.get("retweet_count") or 0)
              for t in tweets)
    rows.append({
        "handle": h,
        "posts": len(tweets),
        "engagement": eng,
        "eng_per_post": round(eng / len(tweets), 1),
    })

for r in sorted(rows, key=lambda x: -x["eng_per_post"]):
    print(f"{r['handle']:<20} {r['posts']:>4} posts  {r['eng_per_post']:>8} eng/post")
Three competitors, one call each, $0.0024. Run it daily for a month and you have a real cadence and engagement series for under a dollar.
Two things this deliberately does not do, because pretending otherwise is how build estimates go wrong.
It does not normalise by follower count. Engagement per post flatters large accounts. A profile read per competitor fixes it and doubles the call count, which is still nothing.
It does not store anything. Printing to stdout is a demo. The real version writes rows to a table with a captured-at timestamp, and that timestamp is the entire value: a snapshot tells you who is ahead today, a series tells you who is accelerating, and only one of those changes a decision.
Share of voice, the measurement that justifies the whole exercise
Cadence and engagement describe your competitors. Share of voice describes the market, and it is the only one of the four that can tell you something you could not have guessed.
def category_mentions(term, pages=5):
    out, cursor = [], None
    for _ in range(pages):
        r = requests.get(f"{BASE}/tweet/advanced_search",
                         headers={"x-api-key": KEY},
                         params={"query": term, "queryType": "Latest",
                                 "cursor": cursor},
                         timeout=30)
        r.raise_for_status()
        page = r.json()
        out += page.get("tweets", [])
        cursor = page.get("next_cursor")
        if not page.get("has_more"):
            break
    return out

mentions = category_mentions("your category term")
share = collections.Counter()
for t in mentions:
    text = (t.get("text") or "").lower()
    for h in COMPETITORS + ["your_handle"]:
        if h.lower() in text:
            share[h] += 1

total = sum(share.values()) or 1
for h, n in share.most_common():
    print(f"{h:<20} {n:>5} mentions  {n/total*100:>5.1f}%")
Five pages, $0.004 a run. The naive substring match is the weak point and worth saying so plainly: it will catch a competitor's name inside an unrelated word and miss every mention that uses a nickname or a misspelling. Tightening it is the actual work, and it is work no dashboard exposes to you either, it simply makes the same choice invisibly and reports the result as fact.
Having the numbers is not the same as knowing what they mean
Every guide on this SERP ends at collection. That is the easy half, and stopping there is why most competitor dashboards get opened twice and then never again.
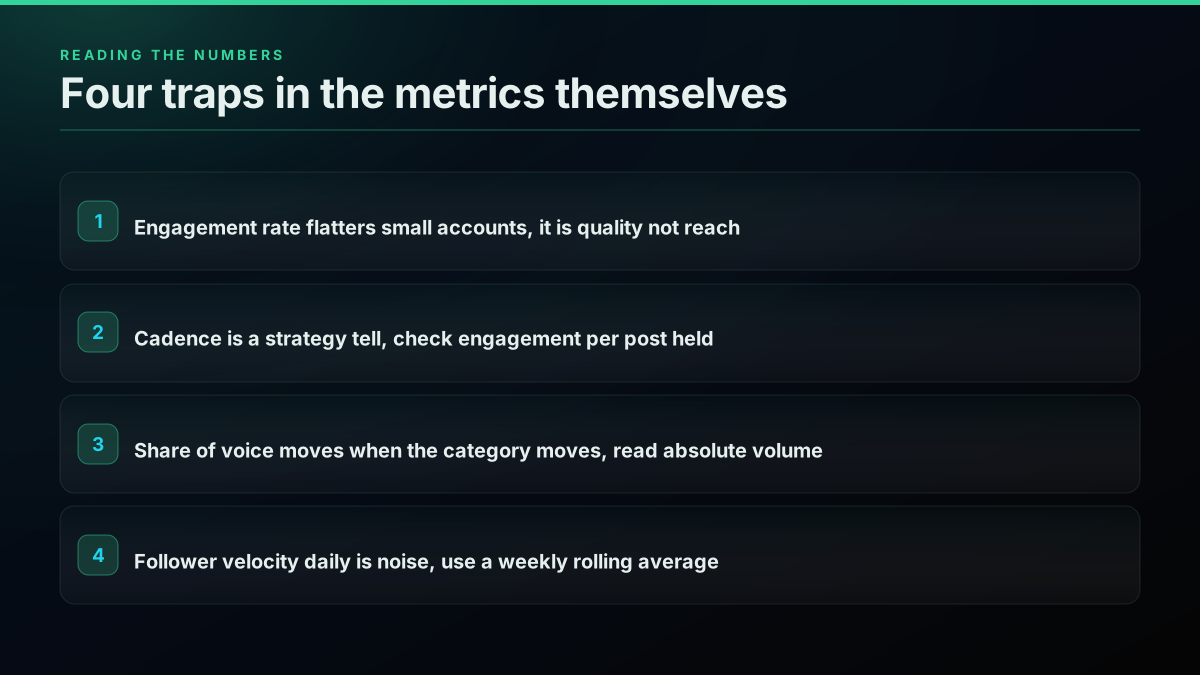
Four traps in reading these metrics, each of which has cost somebody a wrong decision.
Engagement rate flatters small accounts and punishes large ones. A competitor with 2,000 followers getting 40 likes has a 2 percent rate. One with 200,000 getting 800 has 0.4 percent, and is reaching a hundred times more people. Rate is a quality signal, not a reach signal, and treating it as reach is the single most common misread. Track both, and never rank on rate alone.
Posting cadence is a strategy tell, not a scoreboard. A competitor going from 3 posts a week to 20 has not necessarily got better at this. They may have hired an agency, started scheduling a backlog, or begun automating. The number that matters is whether engagement per post held while volume rose. If cadence tripled and engagement per post fell by two thirds, they are producing more and reaching the same people, which is a finding you can act on and they cannot see.
Share of voice moves when the category moves, not only when you do. Your share can fall in a week where you did everything right, because a competitor launched and the whole conversation grew. Always read share against absolute mention volume. A falling share of a doubling market is usually good news, and a rising share of a collapsing one is not.
Follower velocity is the noisiest of the four and the most quoted. Daily follower deltas are dominated by platform-side cleanup, bot purges and a single viral post. A weekly rolling average is the shortest window that means anything, and anyone quoting a day-over-day follower change is quoting noise.
What to do with it on a Monday morning
The output of all this should be a short list of things worth acting on, not a dashboard nobody opens.
Find the posts that outperformed their author's own baseline. Not the highest-engagement posts overall, which are just the biggest account's posts. Divide each post's engagement by that competitor's median, and look at anything above 3x. That set is small, and it is the closest thing to a free content research programme that exists: someone else paid to discover what resonates in your category.
Watch for a competitor's cadence collapsing. A team that posted daily for a year and has posted twice this month has usually lost the person who owned it. That is a hiring signal, a partnership window, and occasionally a competitive one, and it is invisible unless you are collecting.
Track which accounts reply to your competitors and not to you. This is the metric no dashboard sells and the reason the build option exists. The reply graph on a competitor's posts is a list of people who are demonstrably interested in your category and demonstrably not talking to you. It costs one call per post to collect.
Diff the language. Pull the top decile of your competitors' posts by outperformance and read them as a set rather than individually. The vocabulary they use for the problem is frequently not the vocabulary you use, and that gap shows up in search demand long before it shows up anywhere else.
Running it without babysitting it
A collector that needs remembering does not survive contact with a busy month. Three properties make the difference between a series and an abandoned script.
Idempotent writes. Key each row on (handle, tweet_id) or (handle, captured_date) so a re-run repairs a gap instead of double counting. Without this, one retry silently inflates every aggregate downstream, and the corruption is invisible because the numbers stay plausible.
A captured_at on every row, always. The temptation is to store the metric. Store the metric AND the moment you observed it, because follower counts and engagement counts are both moving targets, and a number without its timestamp cannot be compared to anything later.
A loud failure. If the collector dies, you want to know that day, not when someone asks for a chart in six weeks and the series has a hole. Silence from a producer is not a clean result: a dead collector and a quiet week look identical in the data, and only an alert distinguishes them.
That last one is worth more than the rest combined. The most common way this project fails is not a wrong metric or a blown budget. It is a cron job that stopped in March, a series everyone still trusts, and a decision made in June on data that ended three months earlier.
The four metrics, and what each one actually costs
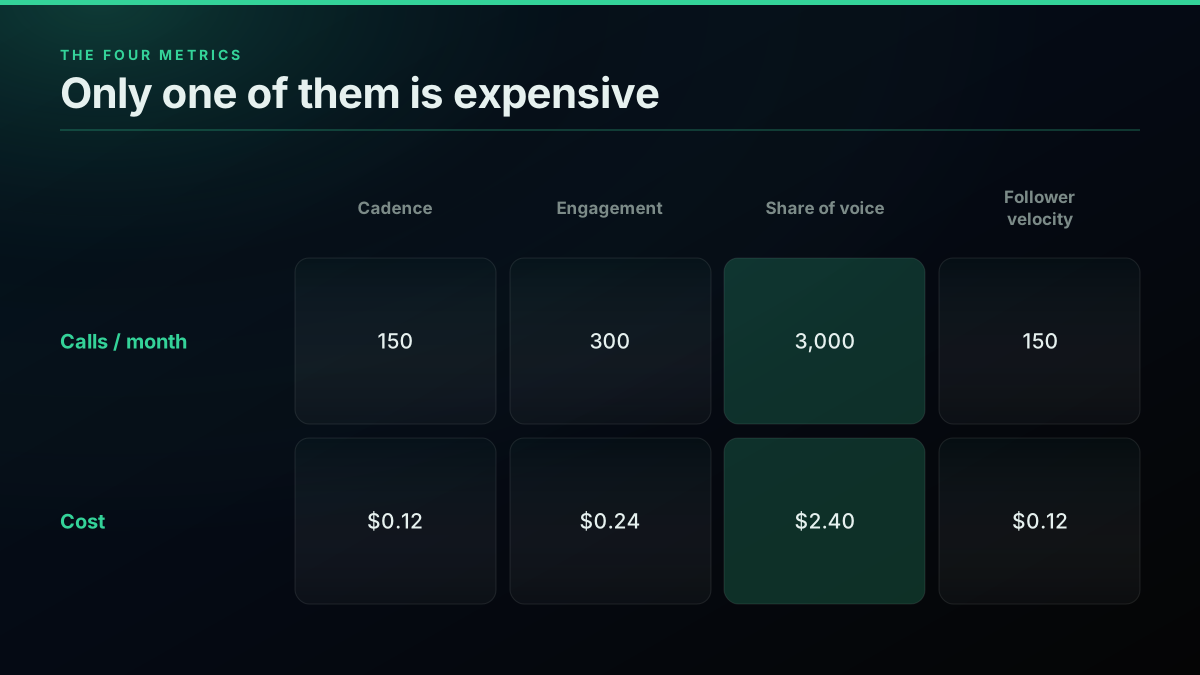
| Metric | What it needs | Calls, 5 competitors daily | Monthly |
|---|---|---|---|
| Posting cadence | one timeline pull each | 150 | $0.12 |
| Engagement rate | timeline + profile for the denominator | 300 | $0.24 |
| Share of voice | category-wide search, not per competitor | 3,000 | $2.40 |
| Follower velocity | one profile read each, as a series | 150 | $0.12 |
| All four | 3,600 | $2.88 |
The table is the argument. Share of voice is 83 percent of the bill and the only measurement that tells you something about the market rather than about your competitors. The other three are rounding errors, and every dashboard prices them as though they were the product.
The cheapest pay-as-you-go Twitter API. Try it free.
$0.0008 a call, about $0.04 per 1,000 tweets at 20 tweets a page. $0.50 free credits. No credit card required.
What the dashboards get right, and it is worth naming
Reading this SERP uncharitably would be easy and wrong. Three things the products do that a build does not, and that the arithmetic above cannot see.
They have already solved the identity problem. Competitors rename handles, run regional accounts, and operate sub-brands. A vendor maintains that mapping. Your script has a hardcoded list that goes quietly stale, and the failure mode is silent: you keep collecting, the numbers keep looking plausible, and one competitor has been missing for six weeks.
They normalise across networks. Most of these products track more than one platform, and a cross-network share-of-voice number is genuinely harder than any single API. If the question spans networks, the build multiplies.
They are somebody else's on-call. When the API changes shape, a vendor absorbs it. When your collector breaks at 3am, the series has a hole in it and nobody is paged.
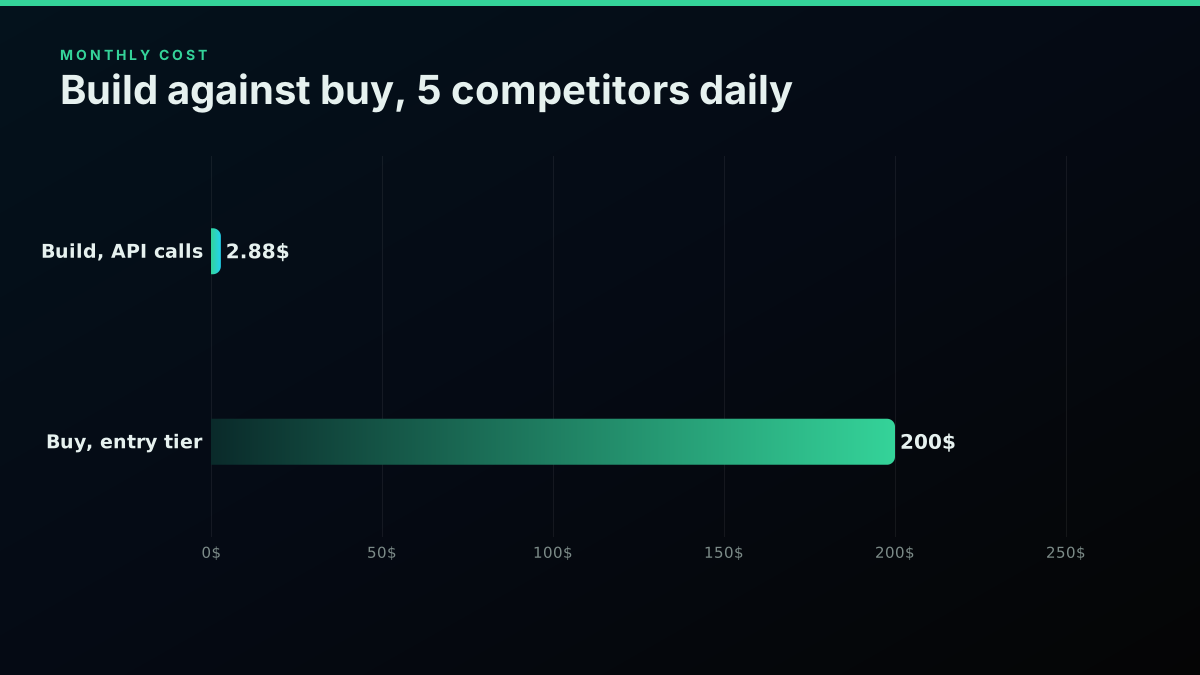
None of that is an argument against building. It is an argument for knowing which of those three you are buying, because if the answer is none of them, you are paying $200 a month for arithmetic that costs $2.88.
What this costs to try
The whole argument above is reproducible for less than a cent, which is the part worth acting on rather than believing.
Pick three competitors. Run the cadence snippet once. That is three calls, $0.0024, and it returns real numbers for real accounts in under a minute. Then run the share-of-voice snippet against your category term for a single day, five pages, $0.004.
Total: under one cent, and you now know your own per-run cost rather than ours. Multiply by your cadence and competitor count and you have a monthly figure specific to your setup, computed rather than quoted.
If that figure is comfortably under a subscription and none of the four buy-side questions returned yes, you have your answer. If it is close, the four questions decide it, not the money. Either way you spent a cent instead of a quarter's budget finding out.
The honest decision procedure
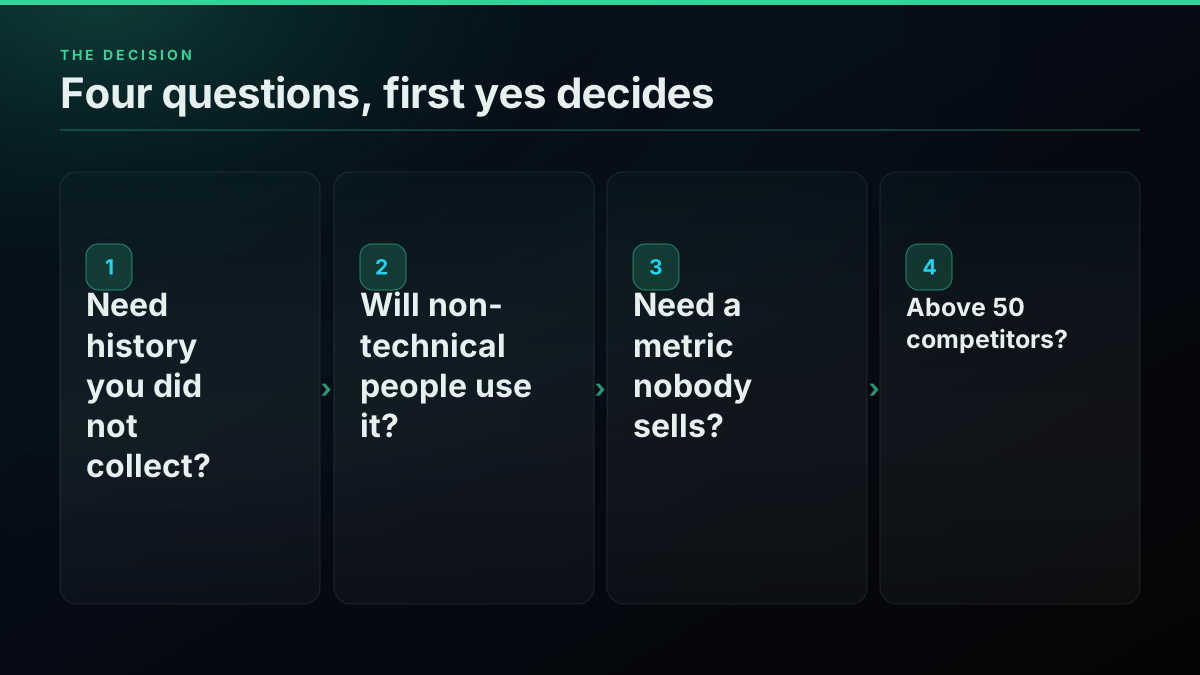
Four questions, in order. The first one that returns yes decides it.
- Do you need history you did not collect? Buy. Nothing else answers it.
- Will non-technical people use this weekly? Buy. Interfaces are the product.
- Do you need a metric no vendor sells, or a join against your own data? Build.
- Are you above roughly 50 competitors, or already paying for the API? Build.
If none returns yes, you are in the middle, and in the middle the tiebreak is not cost. It is whether the engineering time is genuinely free. It usually is not, and $200 a month is a fair price for not spending it.
What we would want a competitor to point out
The $2.64 excludes everything except the API bill. Storage, scheduling, the identity-mapping problem, and on-call are all real and all unpriced here. A build is cheaper on the axis this post measures, and that axis is not the whole cost.
The $200 anchor is soft. Entry tiers vary and scale on dimensions (profiles, seats, history depth) that make a single number misleading. Read the tier that matches your competitor count at the moment you budget, not this line.
Share of voice via substring matching is the weak link. Our own snippet says so. Doing it properly means handling nicknames, misspellings and false positives, and that is exactly the work a vendor has already done and does not show you.
The claim we will defend is narrow: for a fixed competitor set, at a stated cadence, the API arithmetic is reproducible in a minute and the answer is single-digit dollars a month. Whether that beats a subscription depends on four questions about your team that no page on this SERP asks, because asking them honestly would cost most of the vendors on it the sale.
Before committing to any monitoring product, it is worth knowing what a monitor should tell you when it is failing, because a dead collector and a quiet week produce the same empty inbox.
FAQ
How much does it cost to track competitors on X with the API? Tracking 5 competitors daily across cadence, engagement, share of voice and follower velocity costs about $2.88 a month in API calls, at $0.0008 per call and 20 tweets per call. Fifty competitors costs about $4.80, because share of voice is category-wide and does not scale with competitor count.
Why is tracking 50 competitors barely more expensive than 5? Because the expensive measurement is category-wide. Share of voice searches the whole conversation once regardless of how many competitors you track, so competitors 6 through 50 only add their own timeline and profile reads.
Is it cheaper to build than to buy? On API cost, dramatically. On total cost, only sometimes. The build excludes storage, scheduling, the competitor-identity mapping problem and being your own on-call, and it cannot retroactively collect history you did not start gathering.
What can a dashboard do that a build cannot? Show you history from before you started, present it to non-technical colleagues, and absorb API changes without paging you. Those three are the real product, not the metrics.
What can a build do that a dashboard cannot? Compute a metric nobody sells, join competitor data against your own systems, and scale past the point where per-profile pricing stops making sense.
The verdict
Nine of the ten pages ranking for this teach you what to track and then sell you a dashboard. That is not a conspiracy, it is a business model: a vendor cannot publish the build-it-yourself arithmetic without arguing against its own price.
So here it is. Five competitors, all four metrics, daily: $2.88 a month. Fifty competitors: $4.80. The calls are above and they run in a minute.
Then ask the four questions. If you need history you did not collect, or non-technical people need an interface, buy it and do not feel clever about the arithmetic. If you need a metric nobody sells, or you are already paying for the key, the build is not a project, it is an afternoon.
What nobody should do is choose without knowing the number, which until now was the only option this page offered.
A note on the SERP that produced this post
Worth stating plainly, because it is the reason this post exists in the shape it does.
Ten results, ten distinct domains, and nine are social-media-management SaaS. Six of those nine are product pages. The category incumbent ranks eighth on its own category term, which tells you nobody has consolidated this query and the demand is being served by whoever showed up.
The three that are genuinely editorial all follow the same arc: define the metrics, explain why they matter, describe a method, then stop exactly where implementation would begin. Reading them in sequence, the stopping point is so consistent it is clearly structural rather than accidental. None is badly written. Each simply cannot go further without arguing against its own price.
The tenth is a personal Medium post titled around ignoring competitor analysis for a year, which is the only result on the page written by somebody with no product to sell, and it is not a coincidence that it is also the only one that admits the work is tedious.
That is the whole opportunity. Not better writing, not more depth for its own sake, just the arithmetic nobody selling a dashboard is able to publish.
If you take one thing from this page, take the habit rather than the numbers: before believing any build-versus-buy comparison, check whether the writer fixed a quantity and showed their arithmetic. Almost nobody does, and the ones who do not are not being lazy, they are avoiding a number that would cost them something.
Frequently Asked Questions
Tracking 5 competitors daily across cadence, engagement, share of voice and follower velocity costs about $2.88 a month in API calls, at $0.0008 per call and 20 tweets per call. Fifty competitors costs about $4.80, because share of voice is category-wide and does not scale with competitor count.
On API cost, dramatically. On total cost, only sometimes. The build excludes storage, scheduling, the competitor-identity mapping problem and being your own on-call, and it cannot retroactively collect history you did not start gathering.
Compute a metric nobody sells, join competitor data against your own systems, and scale past the point where per-profile pricing stops making sense.
Because the expensive measurement is category-wide. Share of voice searches the whole conversation once regardless of how many competitors you track, so competitors 6 through 50 only add their own timeline and profile reads.
Show you history from before you started collecting, present it to non-technical colleagues, and absorb API changes without paging you. Those three are the real product, not the metrics.
Check out similar blogs
More guides on the Twitter/X API, scraping, and pricing.

X/Twitter Statistics in 2026: What an API Can Actually Measure, and What Nobody Can
Most X statistics roundups re-cite the same handful of numbers. We measured what a public API can and cannot see across 34 accounts, printed the query behind every figure, and traced the rest to their real sources.
Best Twitter/X API for Sentiment Analysis: A 2026 Buyer's Guide
Which Twitter (X) data source should actually power a sentiment-analysis pipeline in 2026? We compared the official X API v2, pay-per-call APIs, and scraping libraries on cost per 1,000 tweets, rate-limit headroom, historical depth, and the metadata a sentiment model needs.
Grok Bot Reads X Without API Credits Now. When You Still Need an X Data API
Grok Bot can now search, read and monitor X without X API credits. What the docs confirm, what they leave out, and five jobs that still need an X data API.
What a Twitter Scraper API Bills Per Job: Profiles, Followers, Replies and Search
A rate card for twitter scraper api jobs by data type. What 10,000 profiles, followers, following, replies and search results each bill, on live rates.
TwitterAPIs Is Live on Uneed: A $0.0008 Twitter API With No Developer Account
TwitterAPIs launched on Uneed today. What the pay-per-call Twitter API costs next to the official X API, how a Uneed launch day actually works, and what founders say one delivers.
Build a Crypto Twitter Tracker in Python: Watch a KOL List and Catch Contract Addresses
A runnable Python watcher that polls a named list of crypto accounts, pulls every new post, finds EVM and Solana addresses, and alerts you, with the monthly bill for 25 and 100 accounts.
Watching 50 X Accounts: What Every Poll Cadence Actually Bills
Every monitoring page sells you an interval and calls it real time. None of them prices it. Here is what a one minute, fifteen minute and daily poll across a fixed fifty account roster costs per month, and the route where the watch itself bills nothing.

Why X Advanced Search Misses Posts You Know Exist (2026)
A query that returns nothing is not proof that nothing exists. We searched for 17 posts confirmed to exist, published between 2015 and 2026, and measured which query forms found them and which did not.