GUIDE
Twitter API Reliability, Measured: What Actually Fails Across 5.16 Million Calls
Every vendor publishes an uptime promise. Nobody publishes the failure distribution. Here is what broke across 5,155,699 production calls, by status code, by endpoint and by week.
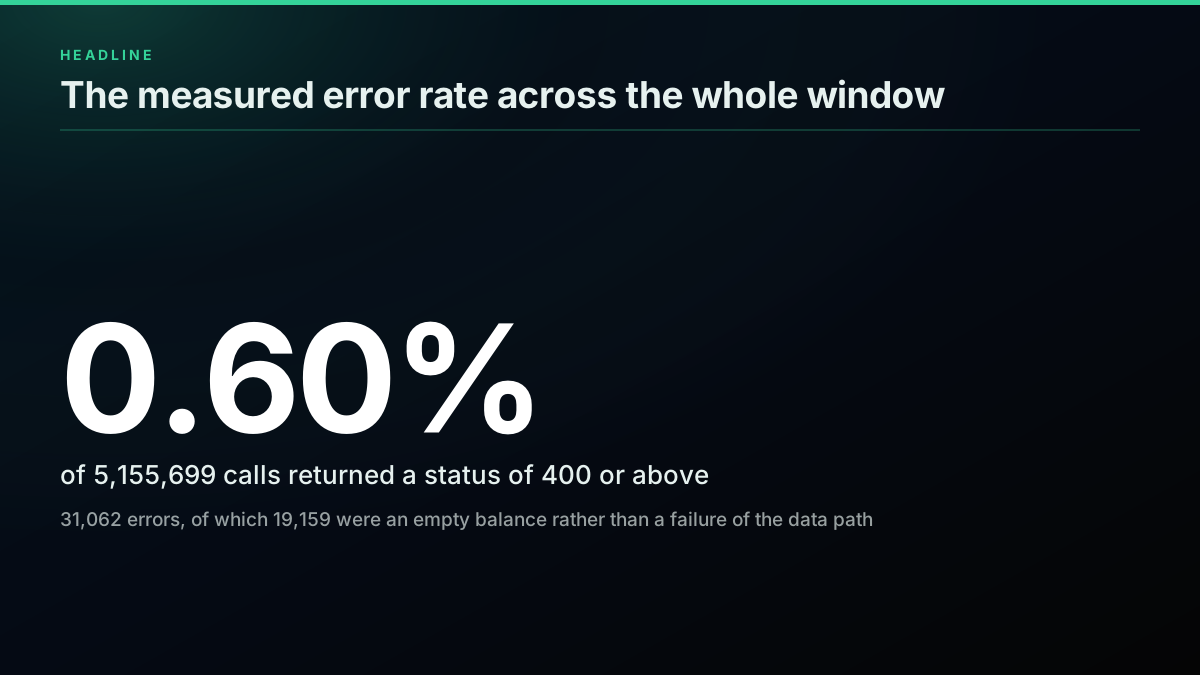
TL;DR: Across 5,155,699 production calls between 2026-06-22 and 2026-09-02, 0.60 percent failed. That headline number hides the useful finding: 61.7 percent of every failure was a 402 raised by the billing layer on an empty balance, which no retry can fix and a balance alarm prevents entirely. Server errors were 27.2 percent, refused writes 7.3 percent, and rate limiting only 3.8 percent. Excluding the billing wall the measured failure rate was 0.23 percent, the eleven busiest read endpoints ran at 0.439 percent while the remaining 62 ran at 9.74 percent, and 62.19 percent of successful reply reads returned zero rows while still being billed.
Ask any data vendor how reliable their API is and you get an availability figure. Ask what actually fails and the conversation stops, because the honest answer requires publishing a failure distribution, and a failure distribution is a document about your own bad days.
This post is that document.
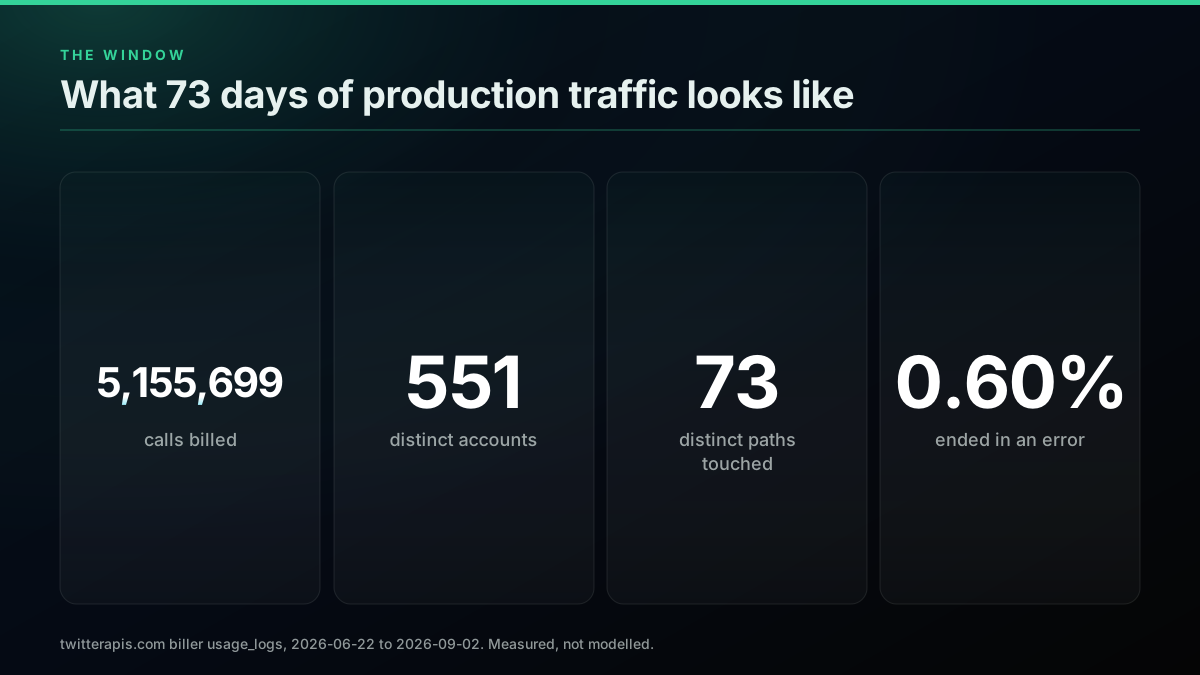
Every number below is read from the billing log that prices this API, which records one row per call with its endpoint, its status code, its error source and, since the field was added, the number of rows the call returned. The window is 2026-06-22 to 2026-09-02, the whole period since that log took its current shape. No sampling, no exclusions, no rounding up. Where a figure is arithmetic on top of measured rows rather than a direct reading, the table says so in its provenance column, and where the honest answer is that something was not separated out, the cell says that instead of showing a confident zero. The same measurement discipline applied to the platform's own public figures is in what an X API can actually measure about X, which traces the widely-cited user numbers to their real sources and prints the query behind every first-party figure.
The reason to publish it is not candour for its own sake. It is that almost every engineering decision people make about error handling is made against a mental model of API failure that the data does not support, and the gap costs real money and real incidents. The model says rate limiting is the main enemy. The data says rate limiting is fourth. The model says server errors are what you defend against. The data says the most common failure in production is an empty wallet.
What is the real error rate of a Twitter API?
Across 5,155,699 calls, 31,062 returned a status of 400 or above, which is 0.60 percent. The other 5,124,747 returned 200. That is the number, and on its own it is close to useless, because the single figure averages together five completely different events with nothing in common except that they are not a 200.
Every status code returned across 5,155,699 calls
| Status | What it means here | Calls | Share of all calls | Share of all errors | Source |
|---|---|---|---|---|---|
| 200 | The call succeeded and was billed | 5,124,747 | 99.3975% | not an error | measured |
| 402 | The account balance was empty | 19,159 | 0.3716% | 61.68% | measured |
| 500 | Upstream fault or a dead session | 8,458 | 0.1640% | 27.23% | measured |
| 422 | The platform refused the action | 2,253 | 0.0437% | 7.25% | measured |
| 429 | The rate window was already spent | 1,173 | 0.0228% | 3.78% | measured |
| 400 | The request itself was malformed | 20 | 0.0004% | 0.06% | measured |
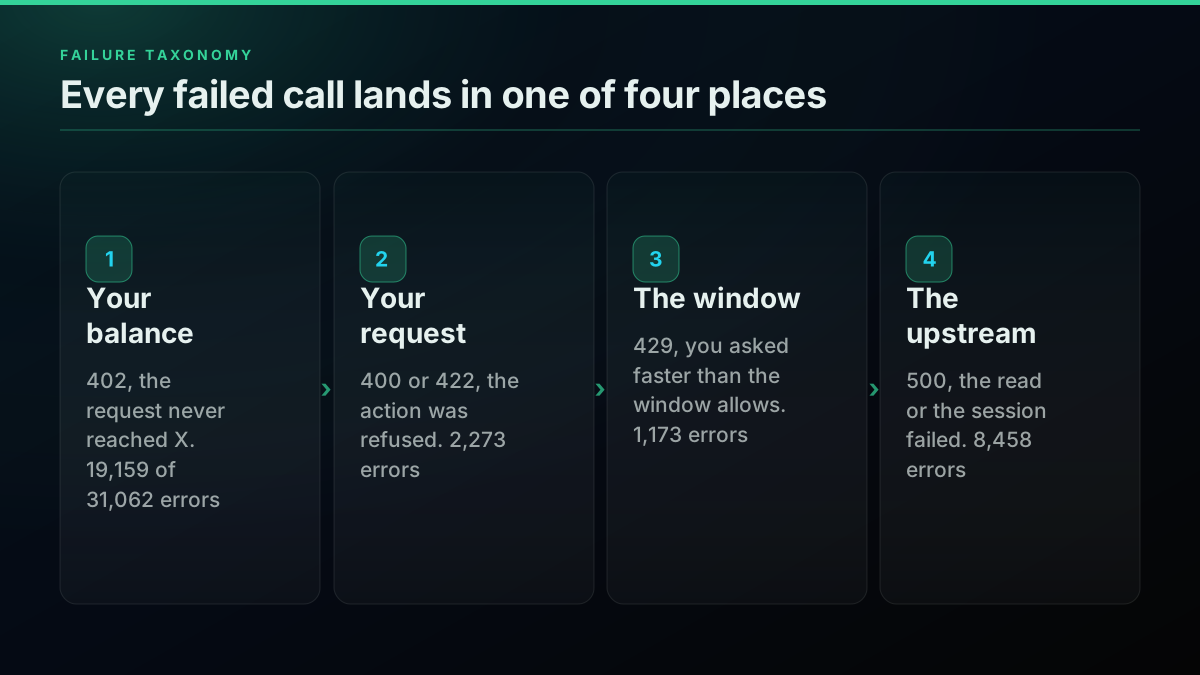
Look at the shape rather than the total. A 402 is the billing layer refusing a call because the account has no credit left. A 429 is the rate window refusing a call because the account has already spent it. A 500 is something behind the read failing. A 422 is the platform accepting the request and then declining to perform the action. A 400 is the request itself being wrong. Only two of those five are anything a vendor could reasonably be measured on, and only two of them can be improved by a retry.
The distribution is lopsided in a way that reverses the usual priorities.
Failure mix
Share of every failure, by class
| Point | Value (%) |
|---|---|
| 402 empty balance | 61.68 % |
| 500 upstream or session | 27.23 % |
| 422 action refused | 7.25 % |
| 429 window spent | 3.78 % |
| 400 malformed | 0.06 % |
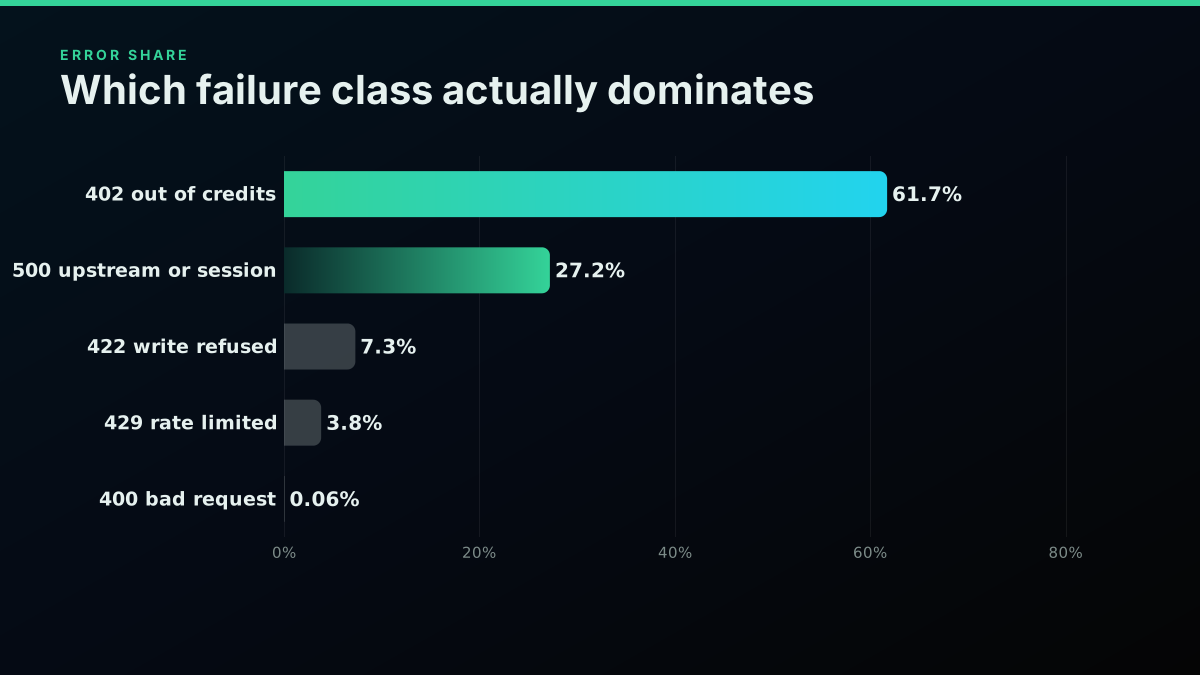
Sixty one point seven percent of every failure in this window was an empty balance. That single class is more than double the second place. It is also, of every class on the list, the one that carries the least information about the API and the most about the caller, and it is the only one that a five line piece of monitoring removes completely.
The practical version of this finding is short. If you are about to spend a sprint hardening your client against rate limits and server errors, and you have not yet written the alert that tells you your balance is low, you are hardening against 31 percent of your measured failures while ignoring 61.7 percent of them.
Why the most common failure is not the platform
There is a temptation, when you run the API, to leave the 402 line out of the published figure. It makes the number look better and it is arguably not a failure of the service at all. That argument is exactly why it belongs in the table.
An engineer integrating a pay-per-call API does not experience a 402 as a billing event. They experience it as their pipeline stopping. The job that was running last night is not running this morning, the dashboard is stale, and the first thirty minutes of the investigation go into the API, the network and the retry logic before somebody thinks to look at the account page. Every minute of that is real, and none of it is visible in an availability figure that quietly excludes the class.
Two hundred and ninety three of the 551 accounts that used the API in this window hit at least one 402. That is 53.2 percent of everyone. It is not an edge case affecting a handful of trial accounts, it is the single most common thing that happens to a working integration, and it is completely preventable.
Worked example
A one-million-call month, sized against the measured failure rates
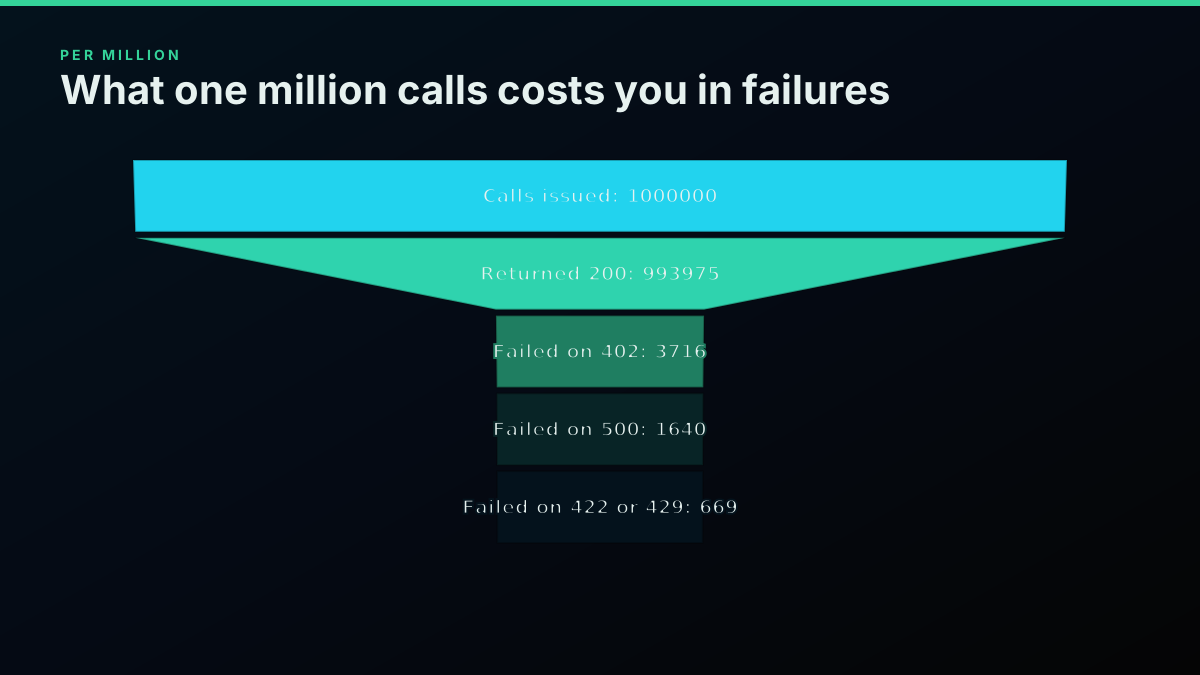
Calls issued: 1,000,000 · Failures expected: 6,025 · Of those, preventable: 3,716
☑ 3,716 will be 402, and a balance alarm removes all of them · ☑ 1,641 will be 500, and up to three jittered retries clears most · ☑ 228 will be 429, and a client-side budget removes most · ☐ 441 will be 422 or 400, and no retry policy helps (Fix the action or the request instead)
An illustration of the measured rates in this post applied to a stated volume of one million calls, not a customer account. Rates derived from 5,155,699 calls logged between 2026-06-22 and 2026-09-02.
The prevention is boring, which is probably why it gets skipped. Read the balance on a schedule. Alert when it falls below the value of one day of your own measured traffic, not below zero, because an alert that fires at zero is a notification that you are already down. If the provider supports automatic recharge, turn it on and set the threshold above your daily burn rather than at the floor. Then stop thinking about it.
There is a second-order version of the same problem worth naming. On a pay-per-call model the balance is a shared resource across everything you run. A backfill job that a colleague started on Friday afternoon can drain the credit that your Monday morning monitoring depends on, and the monitoring will report a platform failure. If more than one workload draws on the same account, either give each one its own key and its own budget, or accept that your alerting cannot distinguish an outage from a neighbour. Our per-endpoint pricing page sets out what each call costs, and the cost calculator will size a month against a stated call volume so the alarm threshold is a number rather than a guess.
What does each Twitter API status code actually mean?
A status code is a contract about who refused and why. The useful question is never what the number is, it is which party said no, because that determines whether anything you do next can possibly work.
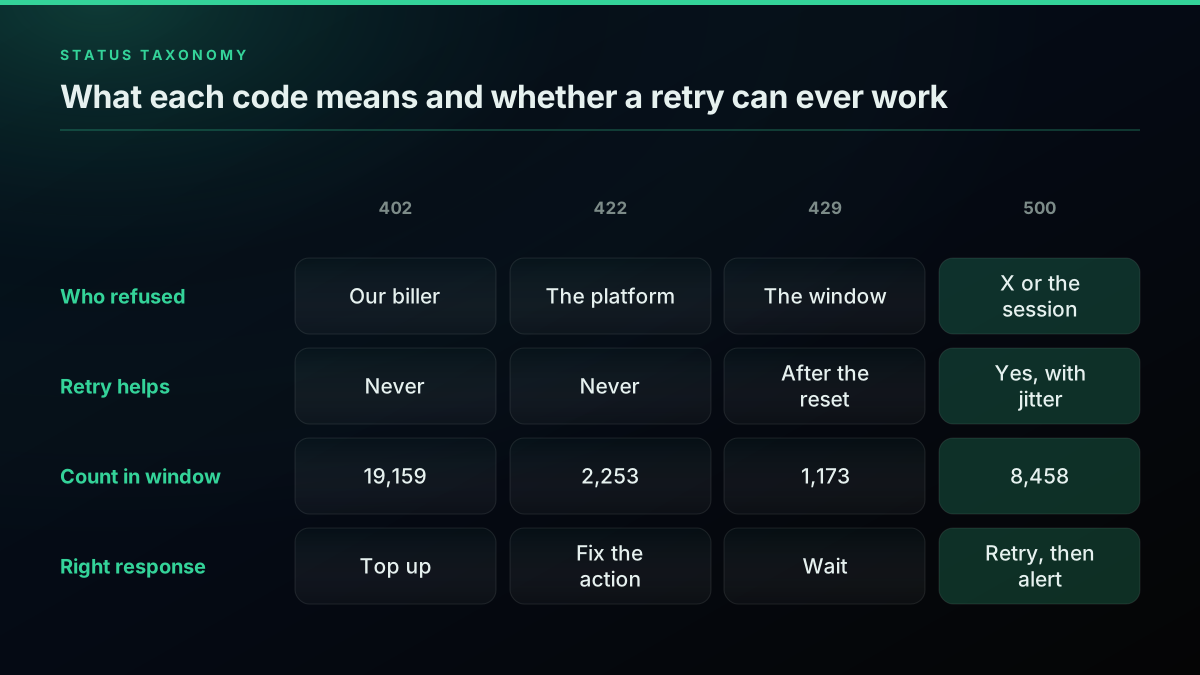
The four codes that matter in production sit at four different layers, and the fix for each one lives in a different place.
402 is your biller. The request did not reach the platform. Nothing about the request was wrong. Retrying is a loop that terminates only when a human tops up the account, and every attempt in the meantime is wasted wall-clock time in whatever scheduler is driving the job.
422 is the platform declining an action. The request was well formed and it arrived. The recorded messages in this window are specific about why: the account behind the write had hit a daily limit, or the action pattern was flagged as automated, or the authorisation to perform it was missing. None of those change if you ask again a second later. They change when the account state changes.
429 is the rate window. This is the only refusal in the set that is purely a function of time. It is the one case where doing exactly the same thing later genuinely works, provided later means after the window resets rather than after a fixed sleep somebody picked years ago and nobody has revisited.
500 is everything behind the read. In this window that covers two visibly different things: a genuine transient fault on a read path, and a dead session behind a write. The messages separate them clearly, with lines like session dead and capped appearing beside the endpoint that raised them, which is the reason the aggregate 500 rate is not a single phenomenon.
Design
The four failure classes have nothing in common except a number
| 402 | 422 | 429 | 500 | |
|---|---|---|---|---|
| Who refused the call | The biller | The platform | The rate window | The upstream or session |
| Does a retry ever work | No | No | After the reset | Often |
| Measured count | 19,159 | 2,253 | 1,173 | 8,458 |
| Accounts that hit it | 293 of 551 | not separated | 243 of 551 | 99 of 551 |
| The fix | Balance alarm | Change the action | Client-side budget | Jittered retry, then shed |
For the full catalogue of codes and their meanings, including the ones that are rare enough not to appear in this window at all, our error code reference is the companion document to this one. This post is about how often each one actually happens.
Which Twitter API endpoints fail the most?
An aggregate error rate assumes the population is homogeneous. It is not. Broken out per endpoint, the spread across a single platform in a single window is about thirty times.
Measured error rate on the eleven busiest read endpoints
| Endpoint | Calls | Errors | Error rate | 500 rate | Source |
|---|---|---|---|---|---|
| user/tweets | 1,699,225 | 7,777 | 0.458% | 0.035% | measured |
| tweet/detail | 1,525,945 | 1,080 | 0.071% | 0.046% | measured |
| tweet/advanced_search | 941,272 | 9,391 | 0.998% | 0.085% | measured |
| user/followers | 313,382 | 136 | 0.043% | 0.024% | measured |
| tweet/retweeters | 169,300 | 388 | 0.229% | 0.170% | measured |
| user/info | 130,050 | 2,847 | 2.189% | 0.137% | measured |
| user/check_follow_relationship | 71,854 | 243 | 0.338% | 0.305% | measured |
| user/following | 67,723 | 93 | 0.137% | 0.078% | measured |
| user/tweets_and_replies | 60,412 | 78 | 0.129% | 0.083% | measured |
| tweet/replies | 58,352 | 114 | 0.195% | 0.142% | measured |
| user/user_about | 27,544 | 90 | 0.327% | 0.134% | measured |
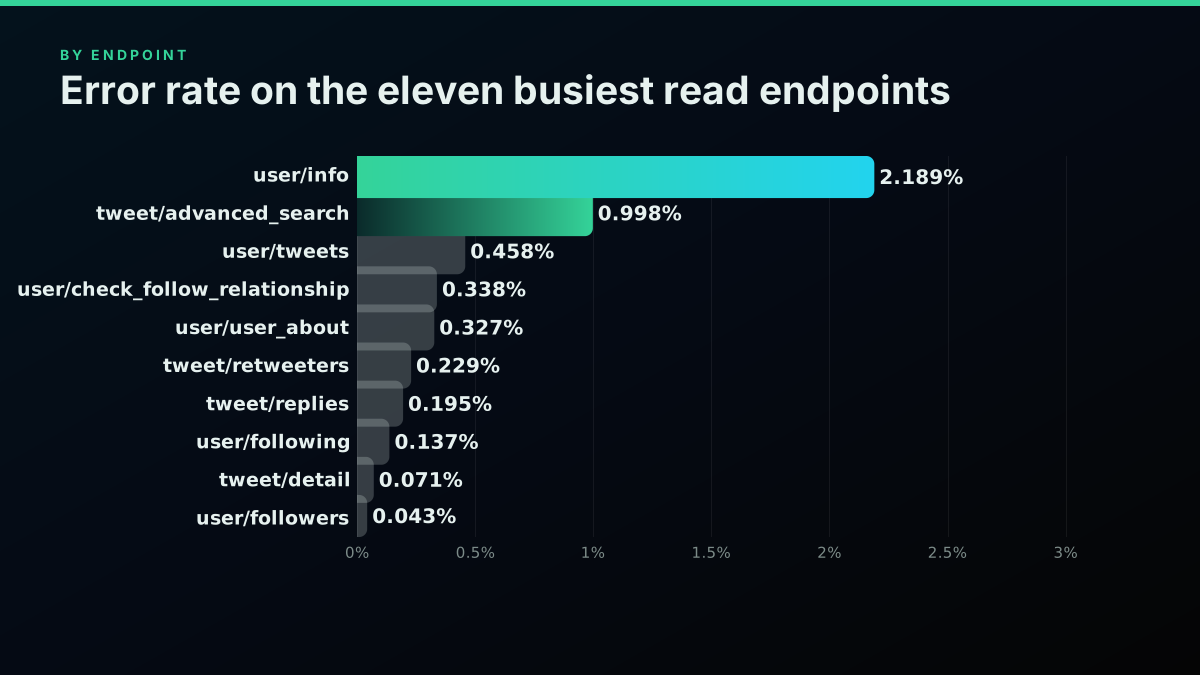
The pattern is legible once you see it. Reads that resolve a single well-formed object are the most reliable things in the catalogue: tweet/detail ran 1,525,945 calls at a 0.071 percent error rate, and user/followers ran 313,382 at 0.043 percent. Search sits an order of magnitude higher at 0.998 percent, which is what you would expect from an endpoint whose job is to evaluate an arbitrary query against a moving corpus. And user/info, at 2.189 percent, is the outlier on the list, largely because a lookup on a handle that has been renamed, suspended or deleted is a normal part of any hydration workload and it resolves to an error rather than an empty success.
That last point deserves a sentence of its own, because it is a design decision that shapes your pipeline. When you hydrate a list of accounts you have collected over time, some of them will no longer exist. That is not a fault, it is the corpus changing under you, and it will show up in your monitoring as an elevated error rate on exactly one endpoint. If you alert on aggregate error rate you will page somebody for it. If you alert per endpoint with a threshold set from that endpoint's own history, you will not.
Now split the corpus a different way, by how busy each endpoint is.
Where the errors actually live, by traffic band
| Band | Paths | Calls | Share of traffic | Errors | Error rate | Source |
|---|---|---|---|---|---|---|
| The eleven busiest reads | 11 | 5,065,059 | 98.24% | 22,237 | 0.439% | derived |
| Everything else | 62 | 90,640 | 1.76% | 8,825 | 9.74% | derived |
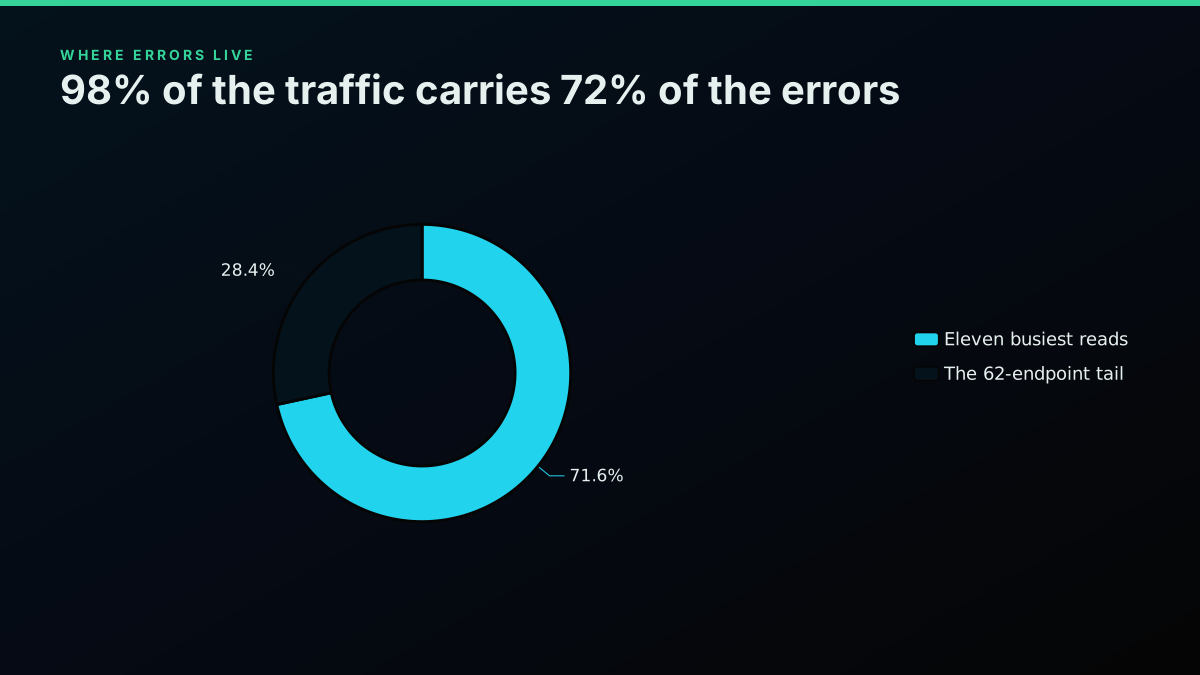
The eleven endpoints that carry 98.24 percent of the traffic ran at a 0.439 percent error rate. The 62 other paths that carry the remaining 1.76 percent ran at 9.74 percent, about 22 times higher. More than half of every server error in the window, 5,372 of 8,458, landed in that thin tail.
Two things are going on, and both are worth understanding before you read this as a quality signal.
The first is a genuine effect. The tail is where the write endpoints live, and a write is structurally different from a read. A read asks the platform a question. A write asks the platform to do something as a specific account, which means it depends on that account's session being alive and on the platform's own account-level enforcement allowing the action. Neither of those is something a data API can promise on your behalf. The recorded error messages make the mechanism explicit: capped, session dead, write not applied, daily limit, and a code 226 that says the request looked automated. Every one of those is the platform making a decision about an account, surfaced through the API rather than caused by it.
The second is a measurement effect you should not read past. A low-volume endpoint has a noisy rate. An endpoint with 900 calls and 90 failures reads as 10 percent, and if 80 of those 90 came from one misconfigured client in one afternoon, the number describes that afternoon rather than the endpoint. This is why the tail row in the table is tagged as derived rather than measured: it is a residual across 62 different paths of different kinds, not a single population, and it should be read as a place to look rather than as a rate to design against.
The honest summary is that if your workload is reads, your expected failure rate is under half a percent and the dominant term is your own balance. If your workload includes writes, you are in a different reliability regime and you should size for it separately. Our best practices guide covers the write path in more detail, and the authentication guide covers what a live session requires.
What does a 500 mean on a data API?
A 500 is the only status in this set that says something went wrong rather than something was refused. It is also the only one where a retry is the correct first response. Across the window there were 8,458 of them, which is 0.164 percent of all calls, or about 1,641 per million.
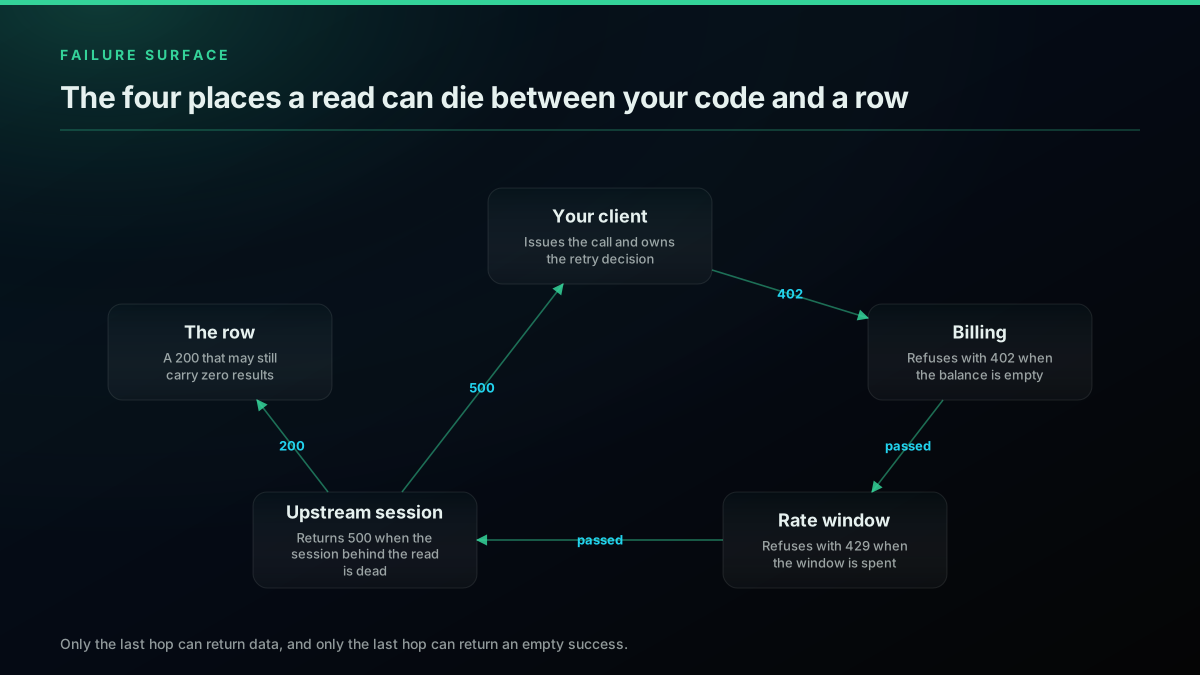
The failure surface
Four gates sit between your client and a row of data
Four gates sit between a client and a row of data, and each raises a different code. Reading the diagram left to right is the whole mental model: the biller can refuse before anything leaves, the rate window can refuse after that, the upstream session can fail after both have passed, and only the last hop can return data at all.
The 500 rate is not uniform across the catalogue and the variation is informative. On tweet/detail it was 0.046 percent. On user/check_follow_relationship it was 0.305 percent, roughly seven times higher on a much smaller base. The endpoints with the higher server-error rates are the ones that resolve a relationship or a graph rather than a single object, and those are the reads with the most moving parts behind them.
There is a subtlety in how a data API surfaces upstream trouble that is worth stating plainly, because it changes what your monitoring means. When the platform behind the API is having a bad minute, a data vendor has two choices. It can pass the failure through as an error, or it can absorb it by retrying internally and return a slower 200. Both are defensible. They produce very different graphs. A vendor that absorbs aggressively will show you a beautiful error rate and a latency distribution with a long tail, and your own timeout will eventually turn that into a failure anyway, at a layer where you have less information about what happened. A vendor that passes failures through will show you a worse error rate and a tighter latency profile.
The reason this matters for your code is that it decides where your timeout should sit. If failures are passed through, your client timeout can be generous, because a genuine problem arrives as a status code rather than as a hang. If failures are absorbed, your timeout is the only thing standing between you and a worker thread parked for a minute on a call that was never going to return. Measure the p99 latency of your own successful calls, set the timeout at a comfortable multiple of it, and treat a timeout as a retryable failure in the same class as a 500.
Google's SRE book has the clearest published treatment of what to do next, and its two rules have survived a decade of contact with production. The first is a retry budget: a per-request cap of three attempts, and a per-client cap where retries may not exceed ten percent of total requests. The second is that randomised exponential backoff is not optional, because retries that are not spread across the retry window arrive together and amplify the very condition that caused them.
The AWS builders' library piece on timeouts, retries and backoff covers the same ground from the server operator's side, and the MDN reference for 429 is the shortest correct statement of what the status means if you need to hand somebody one link. For a second worked example of how a large API documents its own limits, Stripe's rate limit documentation is unusually explicit about the difference between a read limit and a write limit, which is a distinction the measured data in this post also shows. And the current platform pricing page is worth checking directly rather than through any comparison article, because the self-serve model has changed twice since 2023.
Both rules are cheap to implement and both are routinely skipped, usually in favour of a fixed sleep of one second. A fixed sleep is the worst available option: it is long enough to slow your pipeline down and short enough that every client that failed at the same moment comes back at the same moment.
Start building with TwitterAPIs
$0.0008 a call, about $0.04 per 1,000 tweets at 20 tweets a page. $0.50 free credits. No credit card required.
How often you actually see a 429
Rate limiting occupies more space in the literature about API integration than any other failure mode. In this window it was the fourth most common thing that went wrong, at 1,173 calls out of 5,155,699, which is 0.023 percent or about 228 per million.
That is not an argument for ignoring it. It is an argument for putting it in proportion. Two hundred and forty three of 551 accounts, 44.1 percent, saw at least one 429, so it is common in the sense that most integrations meet it eventually, and rare in the sense that it is a tiny share of traffic. It is the failure you hit while developing, when you are hammering one endpoint in a loop to see what comes back, and rarely the failure that takes down a well-shaped production job.
The right response is boring and it lives on your side of the wire. Keep a client-side budget: a token bucket, a semaphore, a simple counter per window, whatever fits your runtime. Size it slightly below whatever the documented limit is so that the platform's counter never becomes your control loop. Then, when a 429 does arrive, read the reset rather than guessing it.
Here is the budget as a token bucket, which is the smallest thing that works and the one most runtimes can express in a dozen lines.
import threading, time

class RateBudget:
    """Client-side ceiling, sized BELOW the documented limit so the
    platform's counter never becomes your control loop."""

    def __init__(self, per_window: int, window_seconds: float = 900.0):
        self.capacity = per_window
        self.tokens = float(per_window)
        self.rate = per_window / window_seconds
        self.updated = time.monotonic()
        self.lock = threading.Lock()

    def take(self, n: int = 1) -> float:
        """Block until n tokens are available. Returns seconds waited."""
        waited = 0.0
        while True:
            with self.lock:
                now = time.monotonic()
                self.tokens = min(
                    self.capacity,
                    self.tokens + (now - self.updated) * self.rate,
                )
                self.updated = now
                if self.tokens >= n:
                    self.tokens -= n
                    return waited
                deficit = (n - self.tokens) / self.rate
            time.sleep(deficit)
            waited += deficit
The X platform rate limit reference documents what its own responses carry: an x-rate-limit-limit, an x-rate-limit-remaining and an x-rate-limit-reset expressed as a Unix timestamp, with windows of fifteen minutes unless the endpoint says otherwise. Reading the reset header and sleeping until that instant is the difference between one retry and a sequence of them.
A correct read of the reset looks like this, with the fallback in it rather than assumed away.
import time

def seconds_until_reset(response, default: float = 60.0) -> float:
    """Prefer the platform's own reset timestamp. Fall back only when it
    is absent, because the header is permitted rather than promised."""
    reset = response.headers.get("x-rate-limit-reset")
    if reset:
        try:
            return max(0.0, float(reset) - time.time())
        except ValueError:
            pass
    retry_after = response.headers.get("retry-after")
    if retry_after:
        try:
            return max(0.0, float(retry_after))
        except ValueError:
            pass
    return default
Two traps are worth naming because both are common and both are invisible in testing.
The first is assuming a Retry-After header will be present. RFC 6585, which defines 429 in the first place, says the response may include Retry-After. It is permitted, not promised. A client whose backoff logic reads that header without a fallback works perfectly against the API it was written for and breaks against the next one.
The second is assuming that throttling always arrives as a 429. GitHub's REST documentation states plainly that exceeding its primary rate limit returns a 403 or a 429, with x-ratelimit-remaining at zero. A client with a branch that reads if status == 429 under-counts throttling on any platform that does that, and the under-count is silent. Branch on the remaining header where one exists, and treat 403 with a zeroed remaining counter as a throttle rather than as an authorisation failure.
The wider engineering community argues about exactly this trade constantly, and the argument is usually more useful than any vendor's guidance page:
That thread reports 2,000 errors across 10 million requests, which is a 0.02 percent error rate, and the failure modes it spends most of its length on are not the API's at all. They are file descriptor limits, ephemeral port exhaustion and socket reuse. At genuinely high concurrency the bottleneck moves off the wire and into your own machine, and no amount of retry logic addresses a client that has run out of file handles.
The 422, and why the platform sometimes says no
A 422 is the least understood code in the set and the one with the most product meaning. There were 2,253 of them, 7.25 percent of all failures, and effectively all of them sat on write endpoints.
The recorded messages are unusually specific. The largest group is a write that was not applied because the account had hit a daily limit imposed by the platform itself. The second names an authorisation refusal. The third is a code 226, which the platform returns when a request looks automated. Each of those is the platform making a policy decision about an account, and each arrives through the API as a 422 because the request was valid and the action was declined.
This is the point at which reliability stops being an engineering property and becomes a product one. If your feature depends on writing as an end user's account, its availability is bounded by that account's standing with the platform, and no vendor and no retry policy changes that. The correct response to a sustained 422 rate on a write path is a product decision about what your application does when the platform says no, not a technical one about how many times to ask again.
For anything that posts, the honest design is to treat a write as a request that can be permanently refused, surface the refusal to the person who owns the account, and keep the read path independent of it. Our DM guide covers the same distinction on the messaging endpoints, where the account-standing question is sharper still.
Can a successful call return nothing?
The failure mode that costs the most and appears in no error log is a 200 with no rows in it. It is a successful, billed call that carries nothing, and across this window it happened on nearly a third of search requests and on more than three in five reply reads.
Successful calls that returned nothing, by endpoint
| Endpoint | Calls with a recorded result count | Returned zero rows | Zero share | Mean rows per call | Source |
|---|---|---|---|---|---|
| tweet/replies | 17,077 | 10,620 | 62.19% | 7.15 | measured |
| tweet/retweeters | 74,815 | 39,174 | 52.36% | 7.38 | measured |
| tweet/advanced_search | 562,238 | 167,107 | 29.72% | 8.19 | measured |
| user/following | 15,218 | 631 | 4.15% | 40.65 | measured |
| user/tweets | 630,228 | 4,659 | 0.74% | 19.04 | measured |
| user/followers | 209,792 | 435 | 0.21% | 49.80 | measured |
| user/info | 59,037 | 0 | 0.00% | 1.00 | measured |
| tweet/detail | 883,520 | 0 | 0.00% | 1.00 | measured |
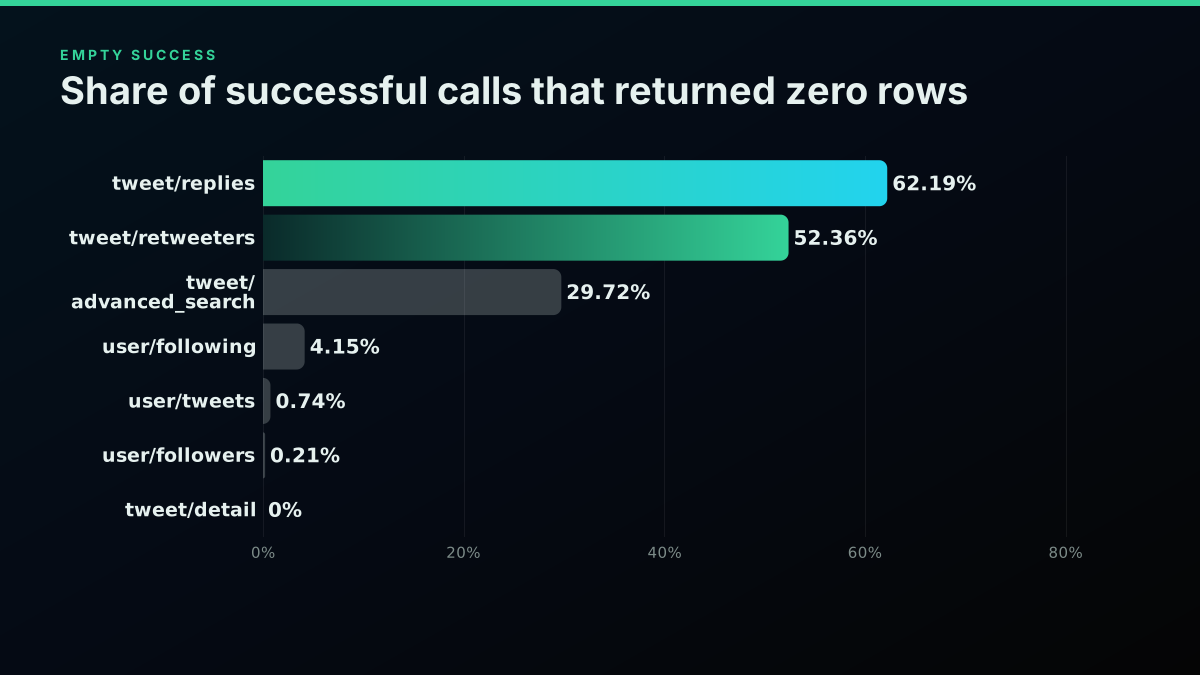
Across the window, 62.19 percent of successful tweet/replies calls returned zero rows. So did 52.36 percent of tweet/retweeters calls and 29.72 percent of advanced search calls. All of those were 200s. All of them were billed. And in a pipeline whose monitoring counts errors, all of them are indistinguishable from a healthy call that happened to find nothing.
Sometimes finding nothing is the correct answer. Most posts have no replies, so a high zero rate on a replies endpoint is a property of the corpus rather than a defect. That is exactly what makes it dangerous: the number is legitimately high, so a change in it does not look like an incident.
Consider what happens when a monitoring query silently stops matching. A brand term gets renamed, a hashtag falls out of use, a filter clause acquires a typo during a refactor. The search calls keep returning 200. The pipeline keeps running. The dashboard keeps rendering, with a flat line that looks like a quiet week. Nothing in an error-rate-based alert fires, because there are no errors, and the fault is only discovered when a human asks why there has been no mention of the product in eleven days.
The fix is one field. Record result_count on every call, and alert on it moving rather than on it being zero. A query that returned an average of forty rows a day for a month and returns zero for two consecutive runs is a signal, and a query that returns zero every day because it always has is not. The distinction requires history, which is why the field has to be logged from the first call rather than added during the incident.
The same field answers the second question that comes up constantly, which is what a call is actually worth.
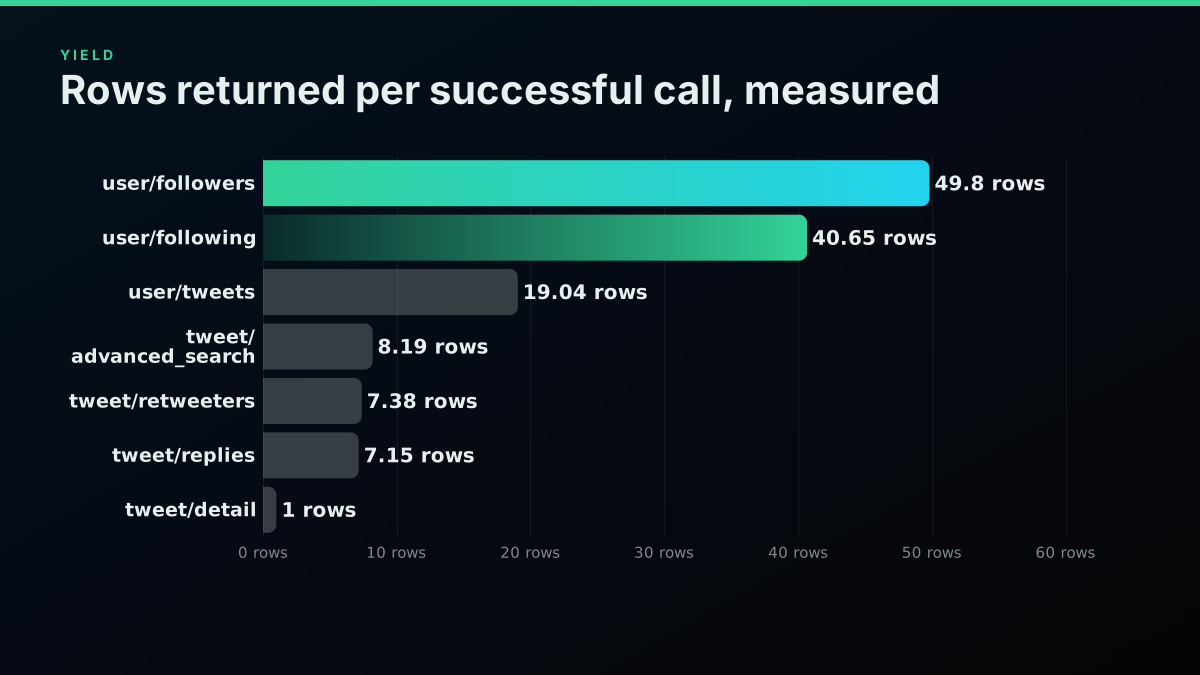
The yields are not close to each other. A single call to user/followers returned a mean of 49.80 accounts. A call to user/tweets returned 19.04 posts. A search call returned 8.19, with a median of 3, which tells you the distribution is heavily skewed by a minority of dense queries. And tweet/detail returned exactly one object every time, because that is what it is for.
That spread is the entire reason a per-call price cannot be compared across endpoints without knowing the yield. At the standard read rate, a thousand follower records cost about two cents, and a thousand search-matched posts cost about ten cents, on identical pricing. Our cost by workload analysis works through what that does to a real budget, and the pagination guide covers how page size and cursor behaviour interact with it.
Two operational notes follow directly from the yield numbers.
First, a truncated page and an exhausted result set look the same to code that only checks for an empty response. If your loop stops when a page comes back with fewer rows than the maximum, it will stop early on any endpoint whose page fill is variable, and search is exactly such an endpoint: a mean of 8.19 against an observed maximum of 20 means most pages are not full. Stop on the cursor, never on the row count.
Second, mean yield is the number to budget with and median yield is the number to design the loop with. A search workload budgeted at 8.19 posts per call will be roughly right in aggregate and wrong on any individual query, because the median is 3. If a specific query matters, measure that query.
What does a real retry budget look like?
Retry logic is where good intentions produce the most damage, because a retry policy that is wrong in the safe direction merely wastes money and a retry policy that is wrong in the unsafe direction takes down the thing it was protecting.
What to do with each failure class, and how much of the corpus it is
| Class | Count | Retry | Backoff | What actually fixes it | Source |
|---|---|---|---|---|---|
| 402 empty balance | 19,159 | Never | Not applicable | A balance alarm and auto recharge | measured |
| 500 upstream or session | 8,458 | Up to three | Exponential with jitter | Retry, then shed and alert | measured |
| 422 action refused | 2,253 | Never | Not applicable | Change the action or the account state | measured |
| 429 window spent | 1,173 | Once | Sleep past the reset | A client-side rate budget | measured |
| 400 malformed | 20 | Never | Not applicable | Fix the request | measured |
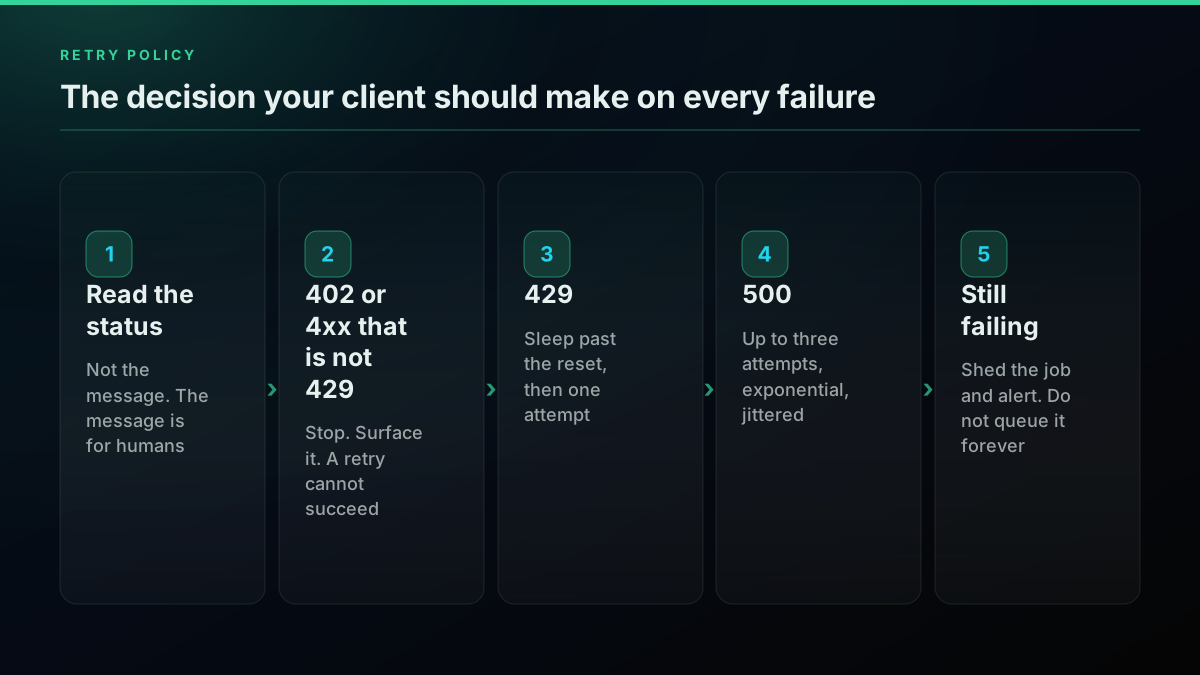
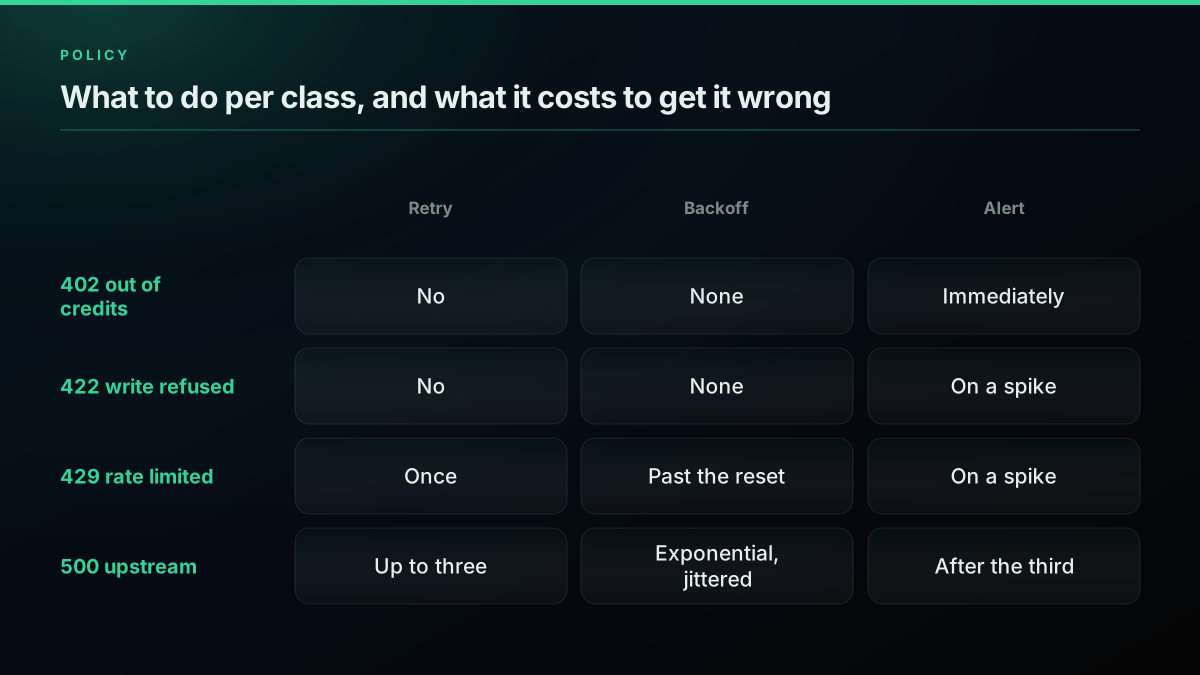
Start from the measured shares, because they set the priority. Of the 31,062 failures, 9,631 are 429 or 500, which is 31.0 percent and the only part a retry can address. The other 21,432, which is 69.0 percent, are 402, 422 or 400, and every retry against those is a call that cannot succeed. A status-keyed branch is therefore not a refinement. It is the difference between a policy that helps a third of the time and a loop that burns a scheduler slot on the other two thirds.
Here is the shape in code. It is deliberately small, because the useful part is the classification rather than the machinery.
import random, time

# Measured failure classes, twitterapis.com biller usage_logs,
# 2026-06-22 to 2026-09-02, n=5,155,699 calls.
RETRYABLE   = {429, 500, 502, 503, 504}
PERMANENT   = {400, 401, 403, 404, 422}
OUT_OF_FUEL = {402}

MAX_ATTEMPTS = 3          # SRE book: per-request cap
BASE_SLEEP   = 0.5        # seconds

def call_with_policy(fn, *args, **kwargs):
    """One call, classified. Returns (response, attempts_used)."""
    for attempt in range(1, MAX_ATTEMPTS + 1):
        r = fn(*args, **kwargs)

        if r.status_code < 400:
            return r, attempt

        if r.status_code in OUT_OF_FUEL:
            # 61.7 percent of all measured failures land here.
            # No retry can clear it. Fail loudly and page someone.
            raise BalanceExhausted(r)

        if r.status_code in PERMANENT:
            # 7.3 percent. The action was refused, not dropped.
            raise ActionRefused(r.status_code, r.text)

        if r.status_code == 429:
            # Read the reset, do not guess it.
            reset = r.headers.get("x-rate-limit-reset")
            wait = max(0.0, float(reset) - time.time()) if reset else BASE_SLEEP
            time.sleep(wait + random.uniform(0, 1))
            continue

        if r.status_code in RETRYABLE:
            # Exponential, and jittered. The jitter is the load-bearing part.
            backoff = BASE_SLEEP * (2 ** (attempt - 1))
            time.sleep(random.uniform(0, backoff))
            continue

        raise UnexpectedStatus(r.status_code)

    raise Exhausted(MAX_ATTEMPTS)
Three details in that snippet are doing most of the work.
The branch is keyed on status_code and never on the message body. Messages are prose written for humans, they change without notice, and a client that string-matches on them breaks silently the first time somebody improves the wording. Every one of the recorded messages in this dataset carries an endpoint name inside it, so a naive substring match on an endpoint would classify a completely unrelated failure.
The 429 branch reads the reset header and falls back to a base sleep only when the header is absent, because the header is permitted rather than promised. And the jitter is added on top of the computed wait rather than replacing it, so two clients that failed in the same millisecond do not retry in the same millisecond.
The cost of getting this right is negligible, which is the last argument for doing it properly.
The policy
What a correct retry branch does, and what it costs
Errors a retry can help: 31.0% · Errors a retry cannot help: 69.0% · Cost of retrying every 500 once: $1.31
☑ Branch on the status code, never on the message string · ☑ Cap at three attempts per request · ☑ Randomise every backoff interval · ☐ Retry a 402 and the loop never terminates (19,159 of 31,062 measured errors were a 402)
Shares are measured from the 31,062 failures in this window: 429 plus 500 is 9,631 of them, and 402 plus 422 plus 400 is 21,432. The dollar figure is the standard read rate applied to the measured 500 rate over one million calls.
At the measured 500 rate, retrying every server error exactly once adds 1,641 calls per million issued. On the standard read rate that is one dollar thirty one per million calls. Retry cost is not a reason to be stingy. The reason for the three-attempt cap is amplification, not budget: a client that retries indefinitely against a struggling upstream converts a degraded service into an unavailable one, which is the failure mode the SRE literature calls congestion collapse.
The same talk covers what the receiving end does about it, which is worth understanding even if you are only ever the caller, because it explains why your polite backoff genuinely helps rather than merely feeling responsible:
https://www.youtube.com/watch?v=fOYOvp6X10g
There is one more class of retry that deserves its own rule, and it is the one that turns a cost problem into a correctness problem. Never retry a write without an idempotency key. A read that runs twice returns the same rows and costs you one extra call. A write that runs twice because the first response was lost in transit posts twice. The 500s in this window include cases where the upstream session died after the action may already have been applied, and there is no way for the client to tell the difference from the outside. If your write path retries at all, it needs a key the server can deduplicate on, and if it does not have one, it should not retry.
One further control belongs beside the retry budget, and it is the one that most integrations add only after their first bad afternoon. A circuit breaker sits above the retry loop and answers a different question. The retry budget asks whether this request should be attempted again. The breaker asks whether requests to this endpoint should be attempted at all right now. When the failure rate on a single endpoint crosses a threshold over a short rolling window, the breaker opens, calls fail immediately at the client without touching the network, and a small number of probe calls are allowed through periodically to test whether the condition has cleared.
import time
from collections import deque

class Breaker:
    """One breaker per endpoint. Opens on a failure ratio over a rolling
    window, half-opens after a cooldown, closes on a successful probe."""

    def __init__(self, threshold=0.5, window=60.0, cooldown=30.0, floor=20):
        self.threshold, self.window = threshold, window
        self.cooldown, self.floor = cooldown, floor
        self.events = deque()          # (timestamp, ok)
        self.opened_at = None

    def _trim(self, now):
        while self.events and now - self.events[0][0] > self.window:
            self.events.popleft()

    def allow(self) -> bool:
        now = time.monotonic()
        if self.opened_at is None:
            return True
        if now - self.opened_at >= self.cooldown:
            self.opened_at = None      # half open, let one probe through
            return True
        return False

    def record(self, ok: bool):
        now = time.monotonic()
        self.events.append((now, ok))
        self._trim(now)
        if len(self.events) < self.floor:
            return                     # too few samples to judge
        bad = sum(1 for _, o in self.events if not o) / len(self.events)
        if bad >= self.threshold:
            self.opened_at = now
The value is not that it saves money, although it does. The value is that it converts a slow, expensive, partially degraded state into a fast and obvious one. A worker pool that is fully occupied waiting on calls that will eventually fail is unavailable in every practical sense while reporting itself as busy. A breaker turns that into an immediate, loggable, alertable refusal, and it does so per endpoint, which matters given the thirty times spread measured across the catalogue. One endpoint having a bad hour should not stop the nine that are fine.
Design for the bad week, not the average
An availability figure is an average, and an average over a period that contains an incident is a number that describes neither the incident nor the rest of the period.
Weekly server-error rate, and why the average is the wrong number
| Week beginning | Calls | 500s | 500 rate | 429s | 402s | Source |
|---|---|---|---|---|---|---|
| 2026-06-22 | 83,784 | 360 | 0.4297% | 18 | 1 | measured |
| 2026-06-29 | 187,405 | 572 | 0.3052% | 0 | 0 | measured |
| 2026-07-06 | 121,406 | 75 | 0.0618% | 0 | 310 | measured |
| 2026-07-13 | 210,761 | 95 | 0.0451% | 39 | 76 | measured |
| 2026-07-20 | 587,471 | 302 | 0.0514% | 162 | 223 | measured |
| 2026-07-27 | 473,135 | 1,150 | 0.2431% | 20 | 62 | measured |
| 2026-08-03 | 557,220 | 3,296 | 0.5915% | 869 | 6,128 | measured |
| 2026-08-10 | 834,723 | 274 | 0.0328% | 9 | 32 | measured |
| 2026-08-17 | 878,218 | 368 | 0.0419% | 1 | 4,361 | measured |
| 2026-08-24 | 898,683 | 890 | 0.0990% | 55 | 5,712 | measured |
| 2026-08-31 | 323,528 | 1,077 | 0.3329% | 0 | 2,259 | measured |
Broken out by week, the measured server-error rate moved between 0.0328 percent in the week beginning 2026-08-10 and 0.5915 percent in the week beginning 2026-08-03. That is a factor of eighteen on the same platform, three weeks apart, on traffic of a similar order. The 429 count in the same two weeks was 9 and 869. Neither week was predictable from the one before it.
A pipeline sized against the good week is not a pipeline that is slightly optimistic. It is one that has never been tested against the conditions that will eventually arrive. If your batch job has a two hour window and it takes 110 minutes at a 0.03 percent error rate with no retries, it does not have ten minutes of headroom. It has ten minutes minus whatever the retries cost on the bad week, and on the bad week the error rate is eighteen times higher.
The practical procedure is three steps and takes an afternoon.
Take your own worst measured week, not the vendor's average and not the average across your whole history. Double it, because the worst week you have seen is not the worst week that exists, and because doubling is a cheap way to buy a margin without inventing a distribution. Then run your job against that synthetic rate, either by injecting failures at the client or simply by adding the equivalent latency, and confirm it still completes inside its window.
Set the alert threshold between the two numbers. Alerting at your measured average produces pages on every ordinary bad day and trains people to ignore the channel. Alerting at the doubled worst case produces a page only when something genuinely new is happening.
The platform's own dev account is worth following for the announcements that move these numbers, because a tier change or an endpoint deprecation shifts the error distribution far more than any code you write:
https://x.com/XDevelopers/status/1960002719353024600
That particular post is a useful reminder that rate limits are a policy setting rather than a law of physics. They are granted, adjusted and revoked, and a client whose budget is hardcoded to a number read from documentation in a previous year is a client with an unexploded assumption in it. Read the limits from the response headers, keep the hardcoded value only as a fallback, and log it when the two disagree. Our rate limit guide covers the current windows in detail, and what rate limited actually means separates the platform's user-facing limits from the API ones, which are frequently confused.
Is failure spread evenly across accounts?
The aggregate rate hides a second lopsidedness that matters if you are trying to work out whether a bad day is yours or everyone's. Errors are not spread evenly across accounts: 27.0 percent of accounts in this window never saw one at all, while a single account produced 17.45 percent of every failure in the dataset.
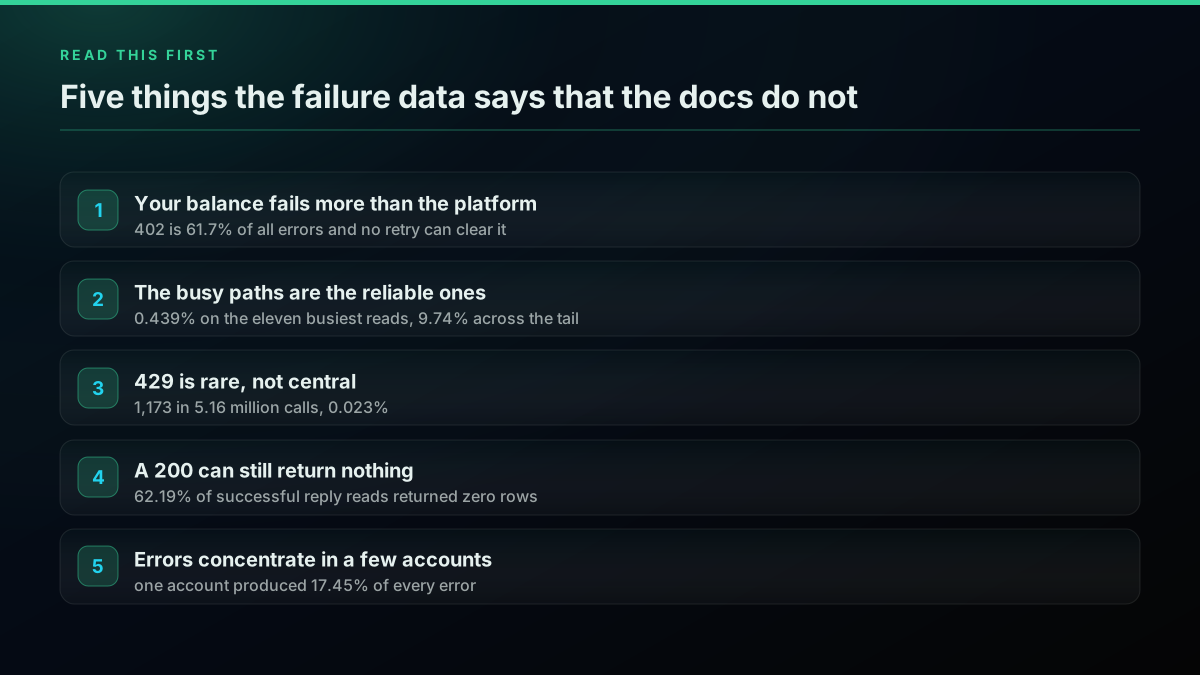
Of the 551 accounts active in this window, 149 never saw a single error of any kind. That is 27.0 percent of accounts with a clean sheet across a period containing 5.16 million calls. At the other end, one single account produced 17.45 percent of every error in the dataset, and the top five between them produced 58.23 percent.
Both halves of that are useful.
The clean-sheet share tells you that a well-shaped integration on the read path really can run for weeks without meeting a failure, so if yours is failing regularly the cause is more likely to be in your client than in the platform. The concentration at the top tells you the opposite thing about aggregate statistics: a published error rate on a multi-tenant API is dominated by whichever tenant is having the worst time, and that tenant is usually one client with a loop that has no ceiling on it.
This is also why a vendor status page and your own error rate can honestly disagree. The status page is reporting the platform's view, which is dominated by the busiest and least careful traffic. Your view is your own. If you want a number you can act on, measure your own error rate per endpoint and compare it against your own history, not against anybody's published figure.
There is a corollary for anyone running a product on top of a data API. If you resell or expose the data to your own customers, your error budget is not one number either. It is a distribution across your customers, and the customer with the pathological query will consume most of it. Instrument per customer as well as per endpoint, and the first genuinely surprising incident will resolve in minutes instead of hours, because the question of who is affected will already be answered.
The cheapest pay-as-you-go Twitter API. Try it free.
$0.0008 a call, about $0.04 per 1,000 tweets at 20 tweets a page. $0.50 free credits. No credit card required.
Six fields, logged from the first call
Every finding in this post came from a log with six fields in it. None of them are exotic and all of them have to be there before the incident, because a field you did not record is a question you cannot ask afterwards.
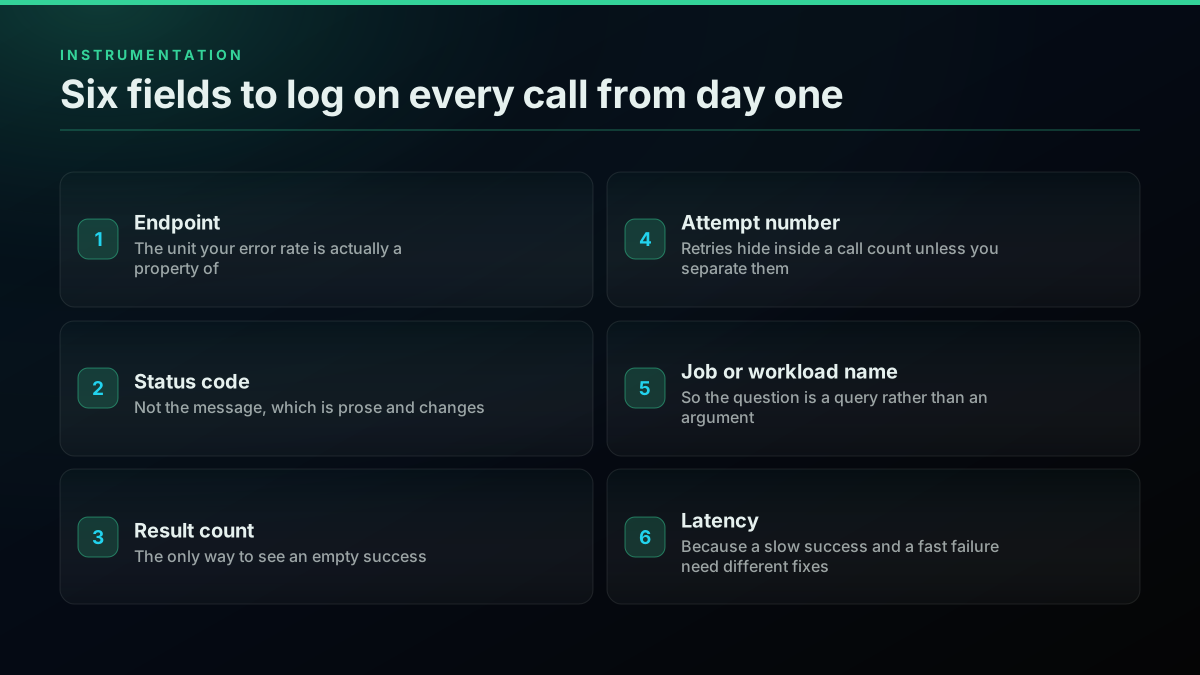
Endpoint. Error rate is a property of an endpoint, not of an API. The spread measured here runs from 0.043 percent to 2.189 percent across a single platform, so an aggregate rate averages a thirty times range into one meaningless number. Every alert threshold should be per endpoint and derived from that endpoint's own history.
Status code. Not the message. Messages are prose, they change, and they carry endpoint names inside them that will confuse any substring matching you are tempted to do. The status is the only stable machine-readable fact about a failure.
Result count. The single highest-value field on the list, because it is the only way to see the empty success. Without it, a query that has silently stopped matching is invisible, and it will stay invisible for as long as your monitoring counts errors rather than rows.
Attempt number. Retries hide inside a raw call count. If you do not separate them, a doubling in traffic and a doubling in your retry rate look identical on the graph, and they need opposite responses.
Job or workload name. Three months from now somebody will ask what a given feature costs to run, or which pipeline is producing all the errors. With this field it is a query. Without it, it is an argument that ends in somebody guessing.
Latency. A slow success and a fast failure both hurt, and they need different fixes. Latency is also the only way to detect a vendor absorbing upstream trouble on your behalf, which shows up as a fat tail rather than as an error.
The thread below is a good illustration of what happens when the instrumentation is added after the problem rather than before it:
https://www.reddit.com/r/webdev/comments/1nyovt1/i_had_to_scrape_36000_pages_and_it_turned_into_a/
The account there describes burning through a large credit balance in a single day and having to restart the job manually because it kept stopping at random. Every symptom in it is a monitoring gap rather than a platform fault. A balance alarm would have caught the first, a per-endpoint error rate would have located the second, and a truncation flag would have told them whether the restarts had cost them data. None of those are difficult. They are simply things nobody builds until the first time they are needed.
One more field is worth adding if you can afford the storage, and that is the request identifier the provider returns. It is useless to you day to day and it is the only thing that makes a support conversation about a specific failure productive rather than speculative.
What no status code can tell you
Everything above is about whether a call succeeded. There is a second question that no status code answers, and it is the one that quietly ruins analyses: whether the data you received is complete.
A 200 tells you the call worked. It does not tell you whether the page you got was the whole answer. It does not tell you whether an account went private between two runs, so that the timeline you have from Tuesday cannot be refreshed on Thursday. It does not tell you whether a post existed and was deleted before you asked, which is indistinguishable from it never having existed. And it does not tell you whether the engagement counts you just recorded will still be the same tomorrow, because they will not.
Those are completeness properties, and they have to be tracked as data rather than inferred from status codes.
The practical instrumentation is a watermark per subject. Store, for each account or query you follow, the newest item identifier you have seen and the time you last read it. On the next run, read forward from the watermark rather than re-walking history, and record explicitly when a read returns fewer items than the gap implies. That gap is the completeness signal, and it is the only one you will get.
The same discipline applies to anything longitudinal. A post returns its current like and repost counts, never the counts as they stood last Tuesday. If you want a trend, you have to record snapshots as you go, and a snapshot you did not take is not expensive to recover later, it is impossible. This is an unusual constraint because it forces a design decision before the data you want exists, which is exactly why it is missed until somebody asks for a chart.
Our coverage honesty piece works through what completeness can and cannot mean on a public data surface, and the history scraping guide covers the watermark pattern in code.
The platform's own product announcements are the other input, because a new delivery mechanism changes what completeness is achievable at all:
https://x.com/XDevelopers/status/1979341139833438693
A push or streaming surface changes the completeness question from "did my poll interval miss anything" to "did my subscription drop", which is a different failure with different instrumentation. Neither is better in the abstract. They fail differently, and the one you should choose is the one whose failure mode you can actually see.
What does this dataset not measure?
A measurement is only useful if its limits are stated, so here are the four things this window cannot tell you. It does not carry latency, it cannot see a request that never arrived, it does not separate write failures per account, and it does not generalise to a different traffic mix.
It does not measure latency. The billing log records the endpoint, the status, the error source and the row count, and it does not record how long each call took. Everything above about timeouts and about absorbed upstream trouble is reasoning from the status distribution and from the recorded error messages, not from a latency series. A latency distribution would change some of the advice in the retry section, and until one is published the honest position is that the timing half of reliability is unmeasured here.
It does not measure availability in the sense a status page means. A call that never reached the service at all, because of a network fault between the client and the edge, leaves no row in a log that is written by the service. Every figure above is conditional on the request having arrived. That is the normal limitation of server-side logging and it means the true client-observed failure rate is higher than 0.60 percent by whatever the network contributed, which is a quantity this dataset cannot see.
It does not separate write failures per account. The 422 row in the comparison grid says not separated for exactly this reason. Refused writes are counted in aggregate and by endpoint, and they were not broken out per account in this window, so a claim about how many accounts hit a write refusal would be an invention rather than a reading.
And it does not generalise to a different traffic mix. The distribution here is dominated by four read endpoints that between them carry more than 80 percent of the volume. An integration whose traffic is mostly writes, or mostly graph walks, sits in a different regime, and the correct move for that reader is to measure their own rather than to inherit these numbers. The method transfers. The specific percentages do not.
How do you reproduce this against your own traffic?
The reason this analysis is possible at all is that six fields were recorded on every call from the beginning. Any team can produce the same view of their own integration in an afternoon, and the result will be more useful than any published figure because it describes their workload rather than somebody else's.
Log one row per call with the endpoint, the status code, the result count, the attempt number, a workload label and the timestamp. Any store will do. A single table in whatever database you already run is fine, and so is a structured log line if you have somewhere to query it.
# The whole instrumentation contract. Six fields, written once per call.
log.info(
    "api_call",
    extra={
        "endpoint": endpoint,          # error rate is a property of THIS
        "status_code": response.status_code,
        "result_count": rows_returned, # 0 is a value, None means unknown
        "attempt": attempt,            # retries hide inside a call count
        "workload": workload_name,     # so "what does X cost" is a query
        "latency_ms": elapsed_ms,      # a slow success is its own failure
    },
)
Then answer four questions in order.
What is my distribution by status code? Group by status and count. If more than half of your failures are a billing or authorisation class, your reliability problem is an operations problem and no code change will touch it.
What is my rate per endpoint? Group by endpoint and compute the share above 400. Set every alert threshold from this table rather than from the aggregate, and expect at least a ten times spread between your best and worst endpoint.
What share of my successes returned nothing? Filter to status 200 and count the rows where the result count is zero, grouped by endpoint. Record the answer as a baseline. The absolute number matters far less than a change in it later.
What was my worst week? Group by week and look at the range rather than the mean. If your best and worst weeks differ by more than a factor of five, an average is not a planning number for you.
-- 1. Distribution by status code.
SELECT status_code, COUNT(*) AS calls,
       ROUND(100.0 * COUNT(*) / SUM(COUNT(*)) OVER (), 4) AS pct
FROM api_calls
GROUP BY status_code ORDER BY calls DESC;

-- 2. Error rate per endpoint. Never alert on the aggregate.
SELECT endpoint, COUNT(*) AS calls,
       COUNT(*) FILTER (WHERE status_code >= 400) AS errors,
       ROUND(100.0 * COUNT(*) FILTER (WHERE status_code >= 400)
             / COUNT(*), 3) AS error_pct
FROM api_calls GROUP BY endpoint HAVING COUNT(*) >= 1000
ORDER BY calls DESC;

-- 3. Empty successes. The failure no error counter can see.
SELECT endpoint,
       COUNT(*) FILTER (WHERE result_count = 0) AS empty,
       ROUND(100.0 * COUNT(*) FILTER (WHERE result_count = 0)
             / COUNT(*), 2) AS empty_pct
FROM api_calls WHERE status_code = 200 AND result_count IS NOT NULL
GROUP BY endpoint ORDER BY empty_pct DESC;

-- 4. The worst week, which is the one to design for.
SELECT date_trunc('week', created_at)::date AS wk, COUNT(*) AS calls,
       ROUND(100.0 * COUNT(*) FILTER (WHERE status_code = 500)
             / COUNT(*), 4) AS server_error_pct
FROM api_calls GROUP BY 1 ORDER BY 1;
Those four queries take longer to write than to run, and the output is the input to every sizing decision afterwards. It is also the only defensible way to compare vendors: a comparison of published availability figures compares marketing documents, and a comparison of your own logged distribution across two providers running the same workload compares the thing you actually care about. Our alternatives comparison sets out the vendor landscape, and the choosing guide covers the criteria that matter beyond price.
Eight things to build before the first scheduled run
Everything in this post reduces to a short list of things that are cheap before launch and expensive afterwards. Eight items cover the failure classes measured here: a balance alarm, a status-keyed retry branch, jitter, a call ceiling, a zero-result counter, a truncation flag, per-endpoint rates, and a dead-letter path.
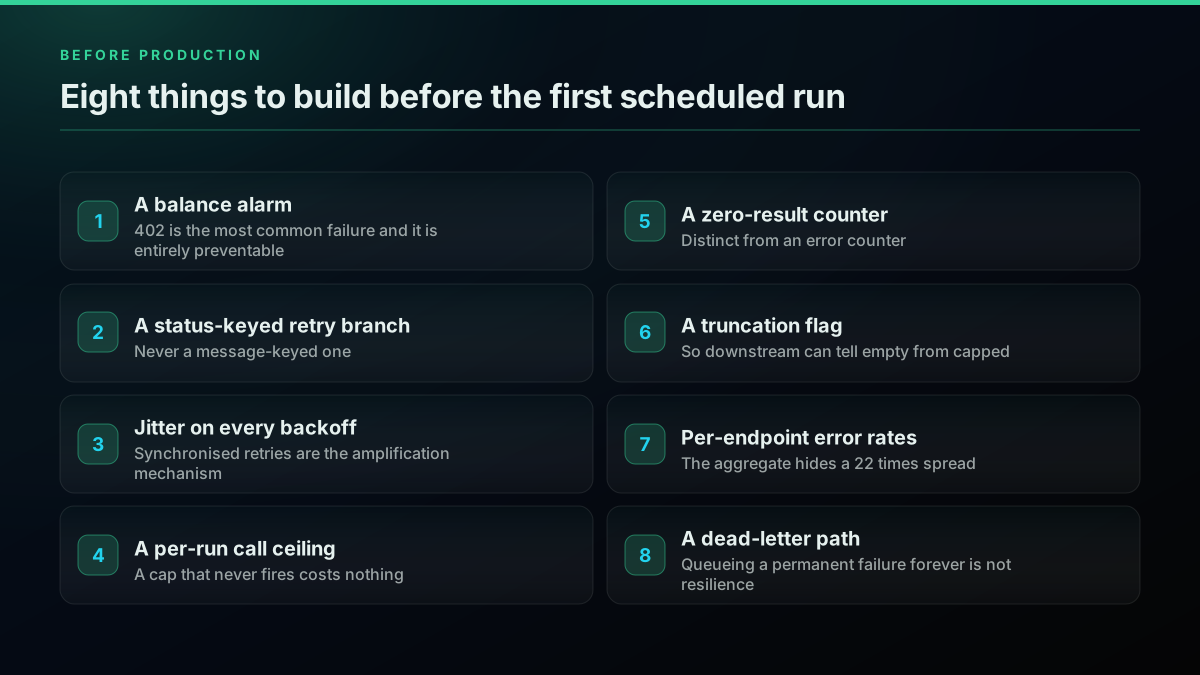
A balance alarm. The most common failure in the measured window, at 61.7 percent of all errors, and the only one on the list that a single scheduled check removes entirely. Set the threshold at a day of your own burn rather than at zero.
A status-keyed retry branch. Never message-keyed. The status is stable, the message is not, and 69.0 percent of measured failures are in classes where a retry is a wasted call.
Jitter on every backoff. Synchronised retries are the amplification mechanism that turns a slow minute into an outage. A random interval costs one line.
A per-run call ceiling. A cap that never fires costs nothing. A missing cap costs exactly once, and the incident is memorable. Log loudly when it fires, because a silent truncation is a completeness bug wearing a cost control's clothing.
A zero-result counter, separate from the error counter. Without it, a monitoring query that has stopped matching looks exactly like a quiet week, and 62.19 percent of successful reply reads in this window returned nothing at all.
A truncation flag carried downstream. Whatever consumes your data needs to know the difference between "nothing matched" and "we stopped early". Both look like a short result set.
Per-endpoint error rates rather than an aggregate. The measured spread is about thirty times across endpoints and about 22 times across traffic bands. One number for the whole API cannot be an alert threshold for any of it.
A dead-letter path. Something has to happen to a permanently failed job other than being queued again. Queueing a permanent failure forever is not resilience, it is a slow leak with a retry loop attached.
None of these are large. Together they are perhaps a day of work at the start of a project, and they are the difference between an integration whose failures are legible and one where every incident begins with somebody guessing.
The reliability question people should be asking
The question that gets asked of a data vendor is "what is your uptime". It is the wrong question, and the honest answer to it is not very useful, because a single figure averages a billing state, a policy refusal, a rate window and a genuine fault into one number that no engineering decision can be made against.
The better question has four parts, and any vendor should be able to answer all of them.
What is the failure distribution by status code, so that the share which no retry can address is visible rather than buried. What is the error rate on the specific endpoints my workload uses, because the aggregate hides a thirty times spread. What was the worst week, not the average, because the worst week is the one my job has to survive. And what share of successful calls return nothing, because that number never appears in an availability figure and it is the one most likely to break an analysis quietly.
For this API over 73 days of production traffic the answers are 0.60 percent overall with 61.7 percent of it being an empty balance, 0.439 percent across the eleven busiest reads, 0.5915 percent of server errors in the worst week against 0.0328 percent in the best, and a zero-result share that runs from nothing on single-object reads to 62.19 percent on replies.
Publish those four numbers and a reader can size a pipeline. Publish a percentage with three nines in it and they cannot.
The wider point is not about any one platform. Reliability on a data API is not a single property that a vendor either has or does not have. It is a set of distinct failure surfaces, each with a different owner, and the useful work is deciding which of them you can control. You control your balance completely. You control your rate consumption almost completely. You control your retry behaviour and your instrumentation entirely. You do not control the upstream, and you do not control the platform's decisions about an account, so those are the two places where the correct engineering response is to fail cleanly and say so rather than to try harder.
Everything else in this post is a way of making that split visible before an incident rather than during one. If you want to start somewhere, start with result_count and a balance alarm. They are the two cheapest fields on the list and between them they cover the most common failure and the least visible one.
You can measure all of this against your own traffic on the free signup credit, which is fifty cents and covers about 625 standard calls, no card required. Point a small job at the endpoints your real workload uses, log the six fields, and read your own distribution rather than ours. Our getting started guide covers the first call, the Python walkthrough covers a working loop, the Node walkthrough covers the same in JavaScript, and the endpoint reference lists what each one returns. When you are ready to run it continuously, sign up and the credit is already on the account.
Frequently Asked Questions
Measured across 5,155,699 production calls on twitterapis.com between 2026-06-22 and 2026-09-02, 0.60 percent of calls returned a status of 400 or above. That is 31,062 failures. The number on its own is close to useless, because 19,159 of those 31,062 were a 402 raised by the billing layer on an empty balance, which is a customer state rather than a fault in the data path. Excluding the billing wall, the measured failure rate was 0.23 percent. Any vendor quoting a single availability figure without that split is telling you less than the number appears to say.
Far less often than the volume of writing about rate limits would suggest. Measured over the same window, 1,173 calls out of 5,155,699 returned 429, which is 0.023 percent, or roughly 228 per million calls. It is real and it needs handling, but it is the fourth most common failure rather than the first. The distortion is easy to explain: 429 is the failure people write blog posts about, because it is the one that arrives during a demo. A 402 arrives quietly at three in the morning.
Almost nothing, which is the surprising part. At the measured 500 rate of 1,641 per million calls, retrying every server error exactly once adds 1,641 calls per million. On the standard read rate of 0.0008 dollars per call that is 1.31 dollars per million calls issued. Retry cost is not the reason to be careful with retries. The reason is amplification: a synchronised retry storm against an already struggling upstream is what turns a blip into an outage, which is why every retry needs randomised backoff rather than a fixed sleep.
Yes, routinely, and it is the failure mode most pipelines never instrument. Across the measured window, 62.19 percent of successful tweet/replies calls returned zero rows, along with 52.36 percent of tweet/retweeters calls and 29.72 percent of advanced search calls. Every one of those was a 200 and every one was billed. If your monitoring counts errors but not empty results, a query that has silently stopped matching anything looks identical to a healthy pipeline, and it will keep looking healthy for as long as nobody checks.
Sharply. Grouping by traffic, the eleven busiest read endpoints carried 5,065,059 calls at a 0.439 percent error rate, while the long tail of 62 other paths carried 90,640 calls at 9.74 percent, a spread of about 22 times. The tail is where writes live, and the recorded messages say why: session dead, capped, and write not applied. A write depends on a live account session and on the platform's own account-level enforcement, and neither is something a data API can promise on your behalf.
402, an empty balance, at 19,159 of 31,062 errors or 61.7 percent of everything that failed. Second is 500 at 8,458 or 27.2 percent, which covers both a genuine upstream fault and a dead session behind a write. Then 422 at 2,253 or 7.3 percent, where the platform accepted the request and refused the action. Then 429 at 1,173 or 3.8 percent. Then 400 at 20 calls, which is 0.06 percent and effectively never. The practical consequence is that the most common failure in production is the one no retry can fix and a balance alarm prevents entirely.
Only on 429 and 5xx, and never on 402, 400 or 422. A 402 means the balance is empty, so every retry is a call that cannot succeed until somebody tops up. A 422 means the platform received the action and refused it, so the same request will be refused again. A 400 means the request itself is wrong. Retrying any of those turns a clean failure into a loop. On the measured distribution, a status-keyed retry branch avoids pointless retries on 69 percent of all failures, because 402, 422 and 400 together are 21,432 of 31,062.
Because the endpoints are doing different work against different upstream surfaces. Measured per endpoint over the window, tweet/detail failed on 0.071 percent of calls and user/info on 2.189 percent, a spread of about thirty times on the same platform in the same window. Reads that resolve a single well-formed object are the most reliable. Reads that walk a graph, and anything that depends on a live session, are less so. This is the reason an aggregate error rate is the wrong number to design against, and a per-endpoint rate is the right one.
Design for the worst week you have measured, not the average. Across eleven weeks the measured weekly 500 rate moved between 0.0328 percent and 0.5915 percent, an eighteen times spread on the same traffic. A pipeline sized against the good week will fall over in the bad one, and the bad one is not predictable from the good ones. The practical rule is to take your measured worst week, double it, confirm the job still completes inside its window at that rate, and set the alert threshold between the two.
Whether the data you got back is complete. A 200 tells you the call succeeded. It does not tell you whether the page you received was the whole answer, whether the account went private between two runs, or whether a post existed and was deleted before you asked. Those are completeness questions and no status code carries them. The only way to see them is to record the result count on every call, keep a watermark per subject, and treat a sudden change in yield as a signal rather than as noise.
Check out similar blogs
More guides on the Twitter/X API, scraping, and pricing.
Grok Bot Reads X Without API Credits Now. When You Still Need an X Data API
Grok Bot can now search, read and monitor X without X API credits. What the docs confirm, what they leave out, and five jobs that still need an X data API.
What a Twitter Scraper API Bills Per Job: Profiles, Followers, Replies and Search
A rate card for twitter scraper api jobs by data type. What 10,000 profiles, followers, following, replies and search results each bill, on live rates.

TwitterAPIs Is Live on Uneed: A $0.0008 Twitter API With No Developer Account
TwitterAPIs launched on Uneed today. What the pay-per-call Twitter API costs next to the official X API, how a Uneed launch day actually works, and what founders say one delivers.
Build a Crypto Twitter Tracker in Python: Watch a KOL List and Catch Contract Addresses
A runnable Python watcher that polls a named list of crypto accounts, pulls every new post, finds EVM and Solana addresses, and alerts you, with the monthly bill for 25 and 100 accounts.
Watching 50 X Accounts: What Every Poll Cadence Actually Bills
Every monitoring page sells you an interval and calls it real time. None of them prices it. Here is what a one minute, fifteen minute and daily poll across a fixed fifty account roster costs per month, and the route where the watch itself bills nothing.

Why X Advanced Search Misses Posts You Know Exist (2026)
A query that returns nothing is not proof that nothing exists. We searched for 17 posts confirmed to exist, published between 2015 and 2026, and measured which query forms found them and which did not.

X/Twitter Statistics in 2026: What an API Can Actually Measure, and What Nobody Can
Most X statistics roundups re-cite the same handful of numbers. We measured what a public API can and cannot see across 34 accounts, printed the query behind every figure, and traced the rest to their real sources.

X API Cost in 2026: Every Tier and Alternative on One Sheet
X bills per resource in 2026. Here is every official rate and every vendor converted to one unit, dollars per 1,000 tweets, with a worked bill.