GUIDE
How to Track a Tweet's Performance in Real Time with the X API
Poll a tweet's engagement counts over time with the X API, compute a views-to-likes ratio, and read the quote-tweet layer to tell an organically growing launch tweet from a boosted one. Tested Python and curl.
Per our own spec, 65 of 112 endpoints bill $0.0008, 24 are free, and 23 sit between $0.0016 and $0.01. Every price ships inside our published OpenAPI document as an x-cost-usd field, so any figure in this post can be checked against the contract that bills it rather than taken on trust.
A launch tweet posts and the first hour decides most of what happens to it. Views climb, or they do not. Replies either turn into a conversation or die out. A handful of accounts quote it, or hundreds do. By the time someone checks the tweet the next morning and screenshots the final numbers, that hour is gone, and so is any chance to learn from HOW the number got there rather than just what it ended at. Tracking a tweet's performance means capturing that shape while it happens: a time series of the same counts, not a single after-the-fact snapshot.
This guide builds that tracker with the X API: a tested Python and curl polling loop that logs a tweet's engagement counts on an interval, a way to compute a views-to-likes ratio you can trust, and a second, more reliable technique for reading the quote-tweet layer to separate a tweet that is growing organically from one carrying a paid or coordinated amplification layer. Every number in the worked example below is pulled live from a real, public tweet, not invented, so you can see exactly what the output looks like before you write a line of code.
TL;DR: Poll the tweet detail endpoint every few minutes for the first hours after a tweet posts, and store the like, retweet, reply, quote, bookmark, and view counts with a timestamp each time. A single call costs $0.0008, so a 24-hour tracking run at a 5-minute interval costs about 23 cents. Compute a views-to-likes ratio against your own account's historical baseline, not a fixed number pulled from elsewhere. For a stronger read on whether growth is organic, pull the quote tweets on the tweet and check what share come from accounts under roughly 500 followers, a pile of near-zero-follower quoters firing in a narrow window is the clearest single tell of a coordinated or bought amplification layer. Signup includes $0.50 of free credit, about 625 calls, with no card required.
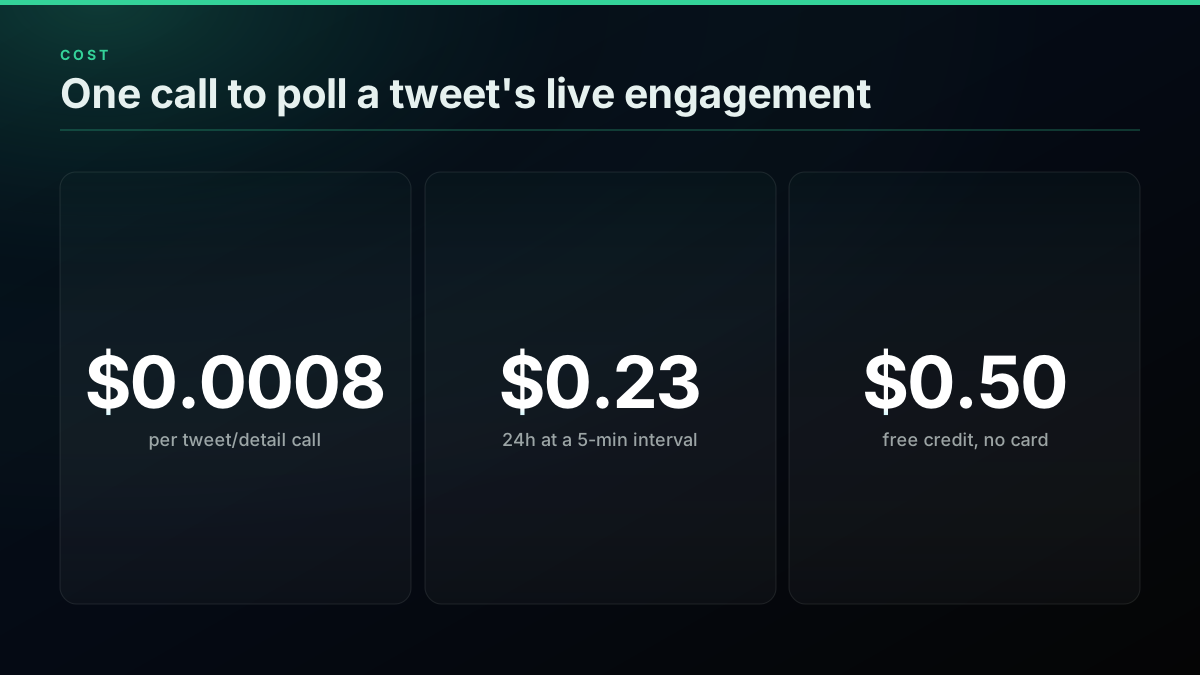
One call, four cents an hour of polling: the real cost of tracking a tweet's performance
Why Isn't a Single Snapshot Enough?
Most people check a tweet's performance the way they check anything else: they look at it once. That single look answers "how many likes does it have right now," which is a fine question if you only ever needed one number. It cannot answer the more useful questions: is engagement still climbing or has it already peaked, did growth come in one sudden burst or build steadily, and does the current shape look like the account's normal range or something unusual. Every one of those needs at least two points in time, and the interesting ones need many.
This is exactly the gap a real founder ran into automating the other side of this problem, growing engagement rather than measuring it, and the same "one number vs. a trend" logic applies to tracking:
I automated my Twitter engagement and got 436k impressions in 2 weeks ($0 ad spend).
The founder's post reports a single self-measured before-and-after comparison, because that is what a manual check gives you: two snapshots, far apart, with no visibility into the shape of the climb in between. A tracker closes that gap. It is the difference between knowing a tweet did well and knowing WHEN it did well, which matters if you want to learn what to repeat.
The friction on the measurement side is real too, and it shows up constantly on developer forums. Even a simple question like "what is my total engagement" trips people up:
"I would like to get the average engagement on twitter, which is: likes + retweets + comments over the last 30 tweets. ... However it doesn't get the retweets when I double checked and I do not know why. ... And I guess I would just have to add the length of the replies to my favorites and retweets to get engagement but once again, it doesn't work and I do not know what to do." Asked by gael1130 on StackOverflow, Sep 7, 2021.
That question has sat with one partial answer for four years. The friction is not the arithmetic, adding four numbers together is not hard, it is getting a consistent, complete set of counts back from the API in the first place. A tested endpoint and a loop that actually logs a timestamp on each poll removes that friction entirely, which is what the rest of this guide builds.
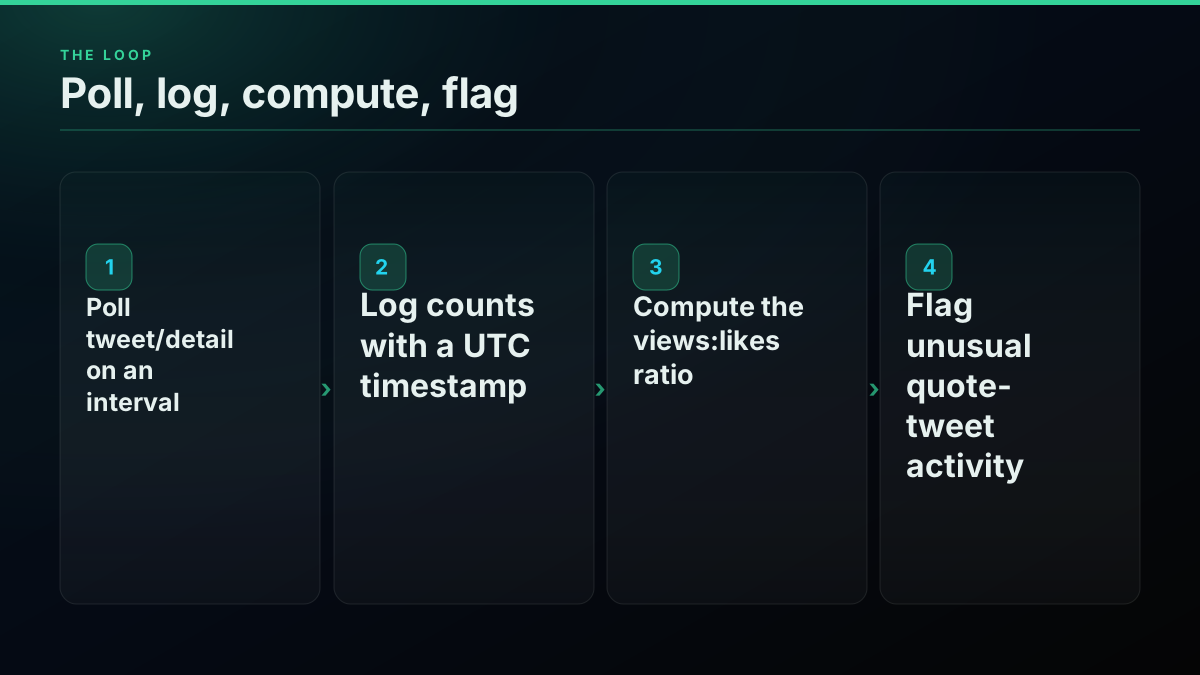
The tracking loop: poll, log, compute, flag
Which Endpoint Gives You a Tweet's Engagement Counts?
A single tweet detail call returns the full current count set for one tweet: likes, retweets, replies, quotes, bookmarks, and views, plus the author's profile. This is the one endpoint the whole tracker is built on. If you have not authenticated to the API yet or are unsure whether a given endpoint is free, confirm your key works before writing the loop:
curl -s "https://api.twitterapis.com/twitter/tweet/detail?tweetId=YOUR_TWEET_ID" \
  -H "Authorization: Bearer YOUR_API_KEY"
# Returns the tweet object as JSON.
# HTTP 401 means a bad or missing key; 402 means out of credits.
The response is already flattened, so the counts you need sit right at the top level of the tweet object:
{
  "id": "1957613818902892985",
  "tweet": {
    "id": "1957613818902892985",
    "text": "We just launched ChatGPT Go in India...",
    "created_at": "Tue Aug 19 01:21:19 +0000 2025",
    "reply_count": 1154,
    "retweet_count": 1680,
    "favorite_count": 24603,
    "quote_count": 685,
    "bookmark_count": 2496,
    "view_count": 4921293
  }
}
That response is live and real, pulled from a public product-launch tweet this guide uses as its running example (more on that tweet below). A single call to this endpoint costs $0.0008, the standard read rate, whether you call it once or on a schedule.
Build the Polling Loop
The loop is short: call tweet detail on an interval, append the result with a timestamp to storage, and stop after a fixed window (most of a tweet's lifetime engagement lands in the first day, so a 24 to 48 hour tracking window covers nearly all of it). This is the whole thing in Python, tested against the live API:
import time
import csv
import requests
from datetime import datetime, timezone

API_KEY = "YOUR_API_KEY"
TWEET_ID = "YOUR_TWEET_ID"
BASE_URL = "https://api.twitterapis.com/twitter"
POLL_SECONDS = 300          # 5 minutes
DURATION_HOURS = 24

def poll_tweet(tweet_id: str) -> dict:
    resp = requests.get(
        f"{BASE_URL}/tweet/detail",
        params={"tweetId": tweet_id},
        headers={"Authorization": f"Bearer {API_KEY}"},
        timeout=10,
    )
    resp.raise_for_status()
    return resp.json()["tweet"]

def track(tweet_id: str, log_path: str):
    end_time = time.time() + DURATION_HOURS * 3600
    with open(log_path, "a", newline="") as f:
        writer = csv.writer(f)
        while time.time() < end_time:
            polled_at = datetime.now(timezone.utc).isoformat()
            try:
                t = poll_tweet(tweet_id)
                views = t.get("view_count") or 0
                likes = t["favorite_count"]
                ratio = round(views / likes, 1) if likes else None
                writer.writerow([
                    polled_at, t["favorite_count"], t["retweet_count"],
                    t["reply_count"], t["quote_count"], t["bookmark_count"],
                    views, ratio,
                ])
                f.flush()
            except requests.HTTPError as e:
                # back off on 429/5xx rather than hammering the endpoint
                print(f"poll failed at {polled_at}: {e}")
                time.sleep(30)
                continue
            time.sleep(POLL_SECONDS)

if __name__ == "__main__":
    track(TWEET_ID, "engagement_log.csv")
Every row is a full snapshot with a timestamp, so engagement_log.csv becomes the actual time series: how fast likes accumulated, whether retweets front-loaded in the first hour or trickled in over the day, and whether the views-to-likes ratio held steady or shifted. The time.sleep(30) retry on a failed poll matters more than it looks, a five-hour gap in the log from one dropped request looks identical to a tweet that suddenly stopped getting engagement, and you cannot tell the two apart after the fact without that retry logic in place.
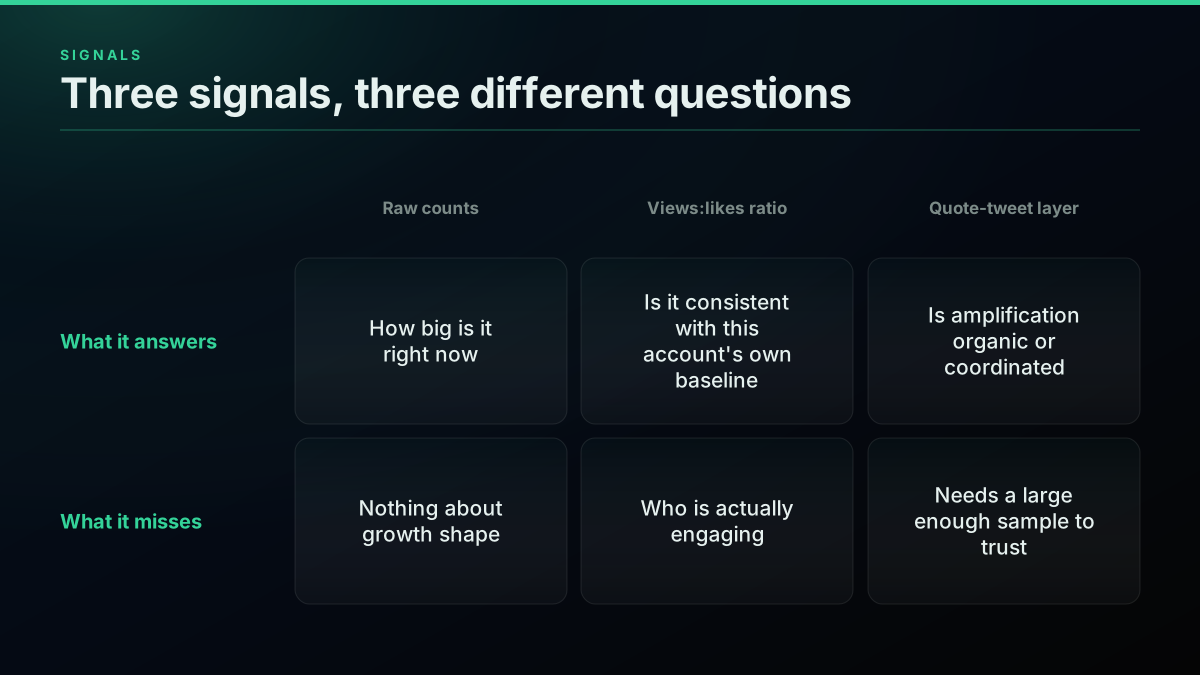
Three signals, three different questions each one actually answers
Signal One: The Views-to-Likes Ratio, and Its Limits
The views-to-likes ratio is the cheapest signal in the whole tracker, it is arithmetic on two numbers you already have. It is also the one most likely to be misread if you treat it as a fixed threshold instead of a comparison against a baseline. A broad, low-friction audience, mainstream news accounts, celebrity replies, produces a naturally high ratio because most viewers scroll past without engaging. A tight, engaged niche audience produces a naturally low ratio because a much larger share of viewers stop to like or reply. Neither is inherently more "real" than the other; they are different audience shapes.
The practical use of the ratio is as a CONSISTENCY check against an account's own history, not a universal scorecard. Log the ratio for an account's last 10 to 20 posts before the launch tweet ships, and treat that range as the baseline. A launch tweet that lands far outside that account's own normal range, in either direction, is the signal worth a closer look. Landing inside the normal range does not prove the growth is entirely organic (a very consistent boosted account would also land "normal" against its own boosted baseline), which is exactly why the ratio is signal one, not the whole picture. Signal two goes further.
Start building with TwitterAPIs
$0.0008 a call, about $0.04 per 1,000 tweets at 20 tweets a page. $0.50 free credits. No credit card required.
Signal Two: Reading the Quote-Tweet Layer
The strongest read on whether a tweet's growth is organic does not come from the tweet's own counts at all, it comes from who is amplifying it. This is a lighter-weight version of the same instinct behind a dedicated bot detection pass: rather than scoring every individual account, sample the amplification layer as a group and read its shape. Pull the tweet's quote tweets, read each quoting account's follower count, and calculate what share of the sample comes from accounts under roughly 500 followers. A pile of near-zero-follower accounts firing quote tweets inside the same narrow window is the clearest single tell of a coordinated or purchased amplification layer sitting on top of a post, independent of whether the underlying tweet is genuinely good.
curl -s "https://api.twitterapis.com/twitter/tweet/quotes?tweetId=YOUR_TWEET_ID&count=50" \
  -H "Authorization: Bearer YOUR_API_KEY"
# Returns up to 50 tweets that quote the given tweet id, cursor-paginated.
def sub500_share(tweet_id: str, sample_size: int = 50) -> float:
    resp = requests.get(
        f"{BASE_URL}/tweet/quotes",
        params={"tweetId": tweet_id, "count": sample_size},
        headers={"Authorization": f"Bearer {API_KEY}"},
        timeout=10,
    )
    resp.raise_for_status()
    data = resp.json()
    quoters = data["tweets"]
    if not quoters:
        return 0.0
    sub500 = sum(1 for t in quoters if t["author"]["followers_count"] < 500)
    return round(100 * sub500 / len(quoters), 1)
One real detail worth knowing before you rely on this: X exposes no dedicated "quote tweets of this tweet" operation, so the quotes endpoint runs a search behind the scenes. The response carries a quote_matched field alongside count, telling you how many of the returned rows demonstrably quote the tweet you asked about. When quote_matched equals count, every row is genuine. Discard a page where it does not, rather than folding possibly-unrelated rows into your follower-distribution math.
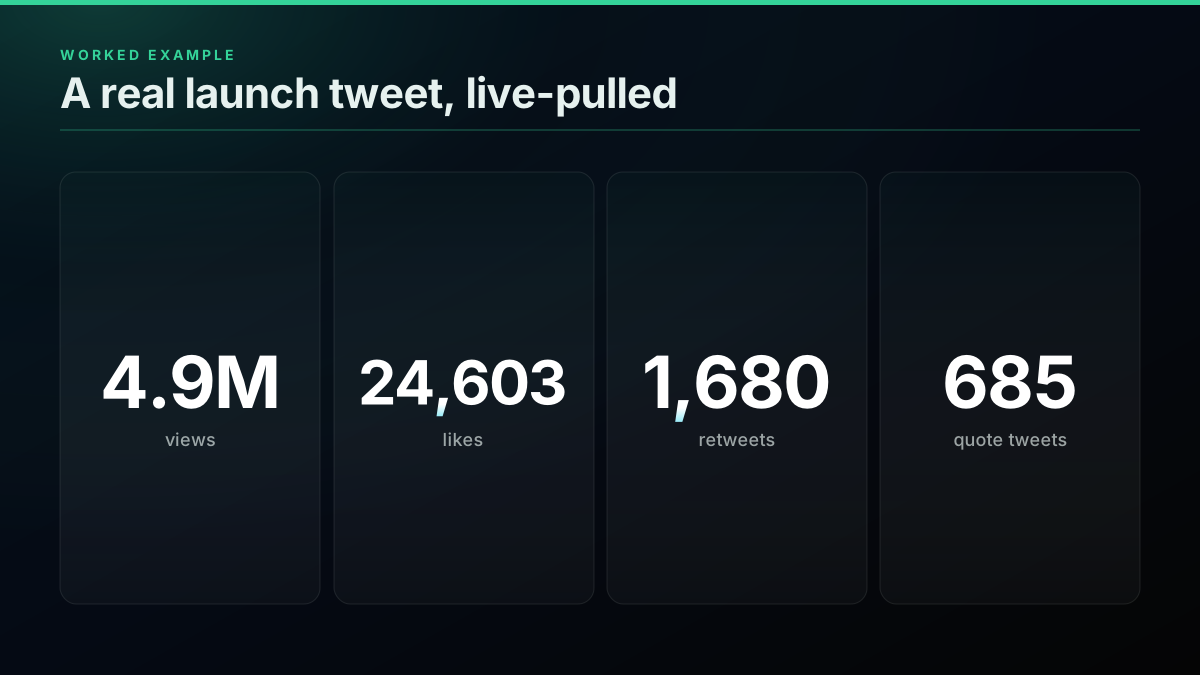
A real launch tweet, live-pulled: the numbers behind the worked example below
A Worked Example: A Real Launch Tweet, Live-Pulled
Every number in this section came from a live call to the endpoints above, on the same day this guide was written, against a real public product-launch tweet. Nothing here is invented or rounded for effect.

Nick Turley
@nickaturley
We just launched ChatGPT Go in India, a new subscription tier that gives users in India more access to our most popular features: 10x higher message limits, 10x more image generations, 10x more file uploads, and 2x longer memory compared with our free tier. All for Rs. 399. 🇮🇳
At the time of this pull, the tweet showed 4,921,293 views, 24,603 likes, 1,680 retweets, 685 quote tweets, 1,154 replies, and 2,496 bookmarks. That is a views-to-likes ratio of roughly 200
, which is on the higher end (consistent with a broad, general-interest launch announcement rather than a tight niche audience, exactly the "know your baseline" point from signal one).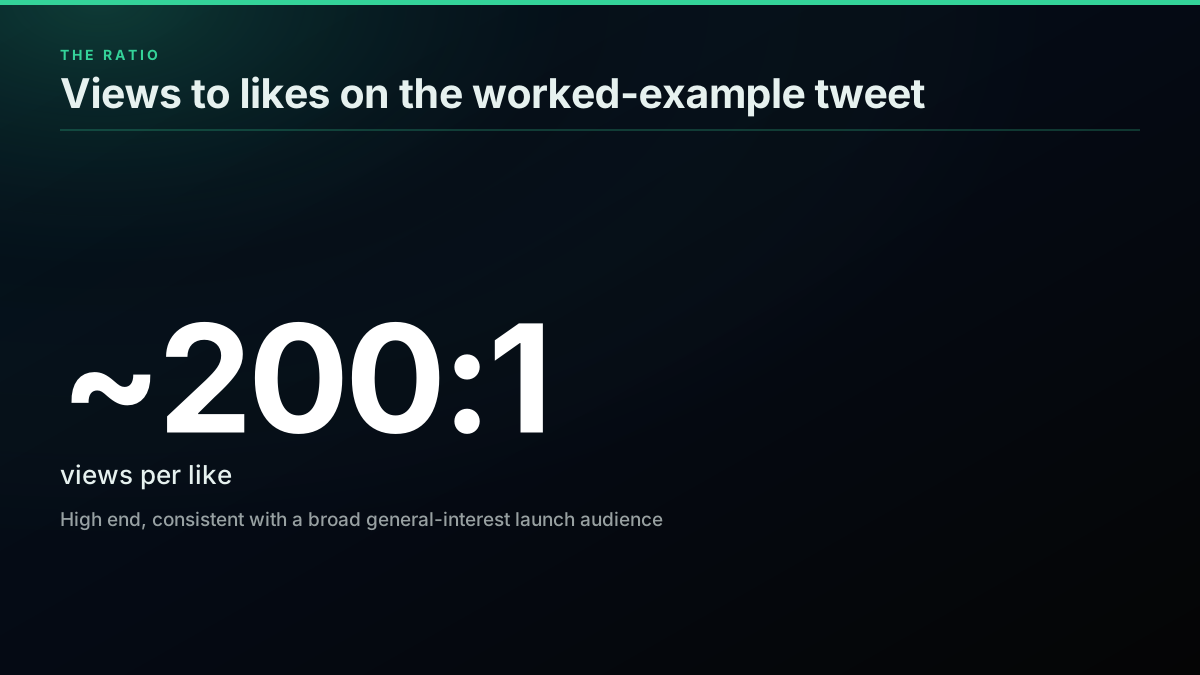
The views to likes ratio on the worked-example tweet: roughly 200 views for every like
Reading the quote-tweet layer adds the second signal. A sample of 20 quote tweets pulled live from this tweet's tweet/quotes endpoint (all 20 confirmed genuine, quote_matched equal to count) showed 8 of the 20 quoting accounts, 40%, had under 500 followers. That range spans real variation: a verified tech journalist with tens of thousands of followers quoting the launch with the headline detail pulled straight from the tweet,

Tibor Blaho
@btibor91
@techeconomyana “10x higher message limits, 10x more image generations, 10x more file uploads, and 2x longer memory compared with our free tier” https://t.co/sIOzsCcAzK
down to a genuine small account with 53 followers writing a personal, unprompted reply about what the feature means to them day-to-day. A 40% sub-500-follower share sitting alongside a normal-range views-to-likes ratio and organic-reading individual quotes, rather than a wall of low-effort near-identical replies firing in the same narrow minute, reads as a broad public reaction spanning big and small accounts, not a coordinated layer. That is the shape of the read this technique produces: not a single pass/fail number, but a pattern across the two signals together.
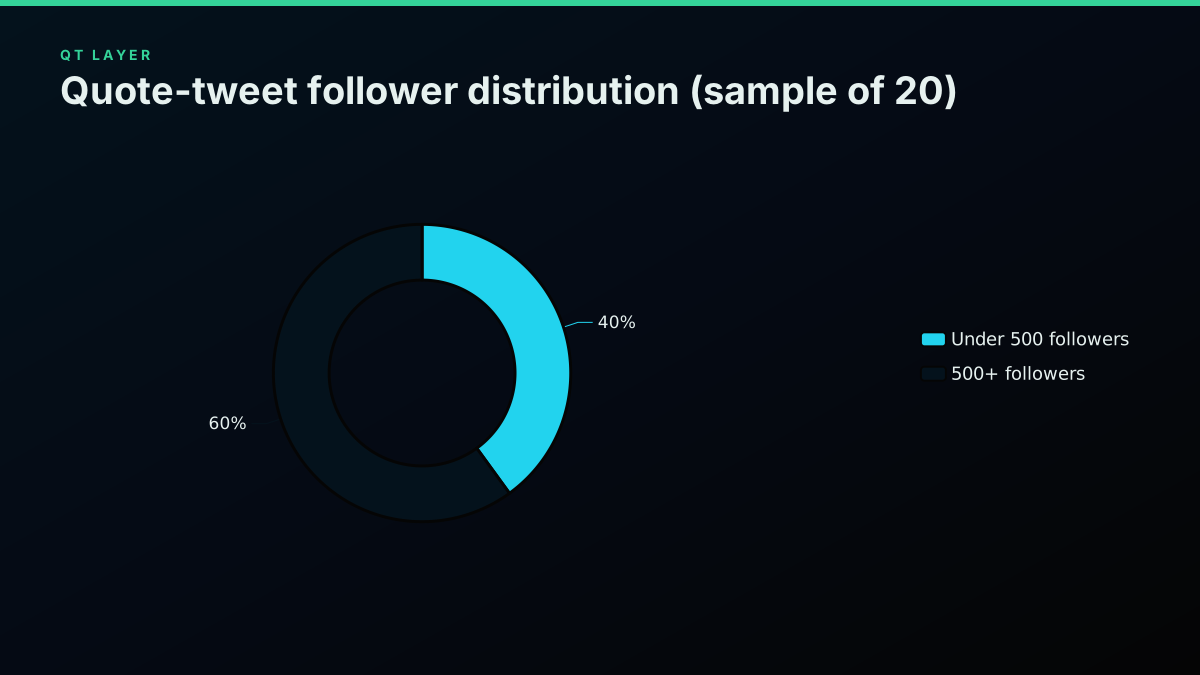
Reading the quote tweet layer: how many quoters are near-zero-follower accounts
What Does Polling Actually Cost?
The Python examples above use the requests library, the standard choice for a simple polling script; if you are coming from tweepy, the older, more full-featured X API wrapper the StackOverflow question above was written against, the raw HTTP calls above map directly onto the same endpoints tweepy wraps, just without the extra abstraction layer. The entire tracker runs on standard-rate reads. tweet/detail, tweet/quotes, and tweet/retweeters all bill at $0.0008 per call, the same rate as every other standard read on the platform, about $0.04 per 1,000 tweets at a full 20-tweet page per call (the default page size, not a guaranteed yield on every call). Signup includes $0.50 of free credit with no card, roughly 625 calls, enough to run a full 24-hour tracking session at a 5-minute interval (288 calls) with credit left over for a quote-tweet pull.
| Poll interval | Calls in 24 hours | Cost in 24 hours |
|---|---|---|
| Every 5 minutes | 288 | $0.23 |
| Every 15 minutes | 96 | $0.08 |
| Every hour | 24 | $0.02 |
| Every hour, for 7 days | 168 | $0.13 |
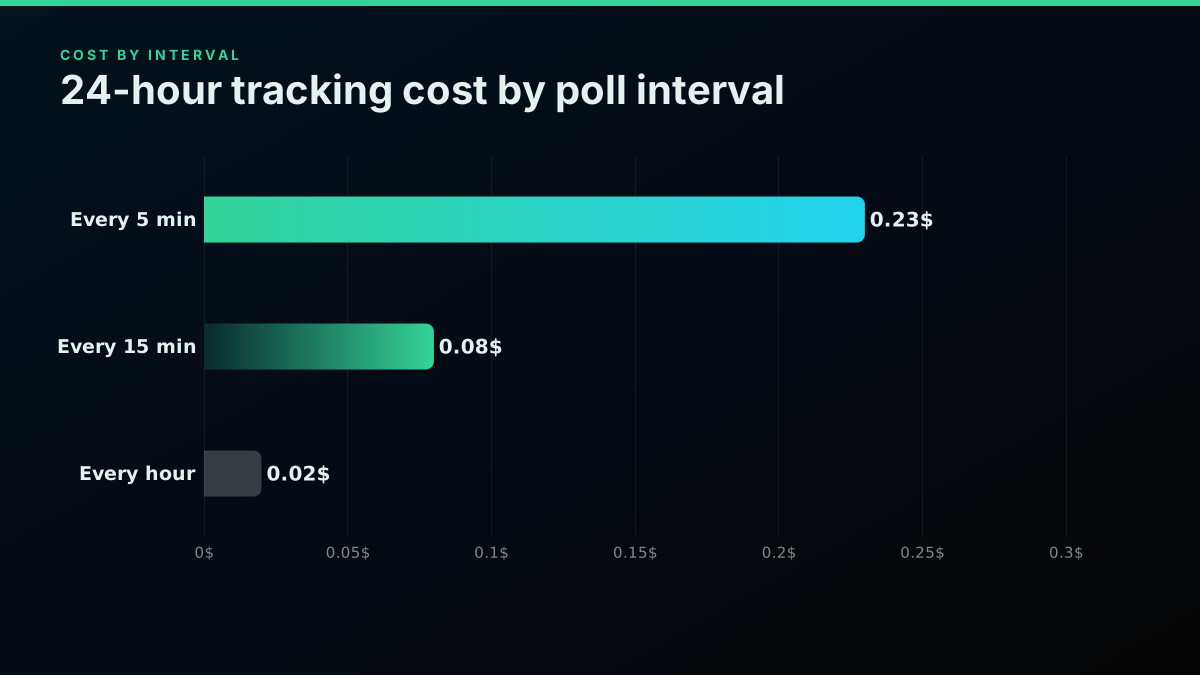
What polling actually costs, by interval, for the first 24 hours after a launch
Compare that to the alternative paths. X's own official Engagement API is a separate enterprise-tier product, gated behind X's managed access levels, and getting access means going through an enterprise sales team rather than self-serve pricing (the official rate limits documentation covers the standard tiers most builders actually use instead). A paid social-listening SaaS tool bundles engagement tracking into a monthly seat, useful if you want a dashboard and do not want to write any code, but it is a fixed monthly cost regardless of how many or how few tweets you actually track. Other third-party API vendors publish their own analytics guides covering the same underlying counts, at their own separate per-call pricing; the full API cost breakdown and how to choose a Twitter API compare providers on more than just this one tracking use case. For the specific job of watching how one tweet's counts change over time, a pay-per-call polling script covers it for cents.
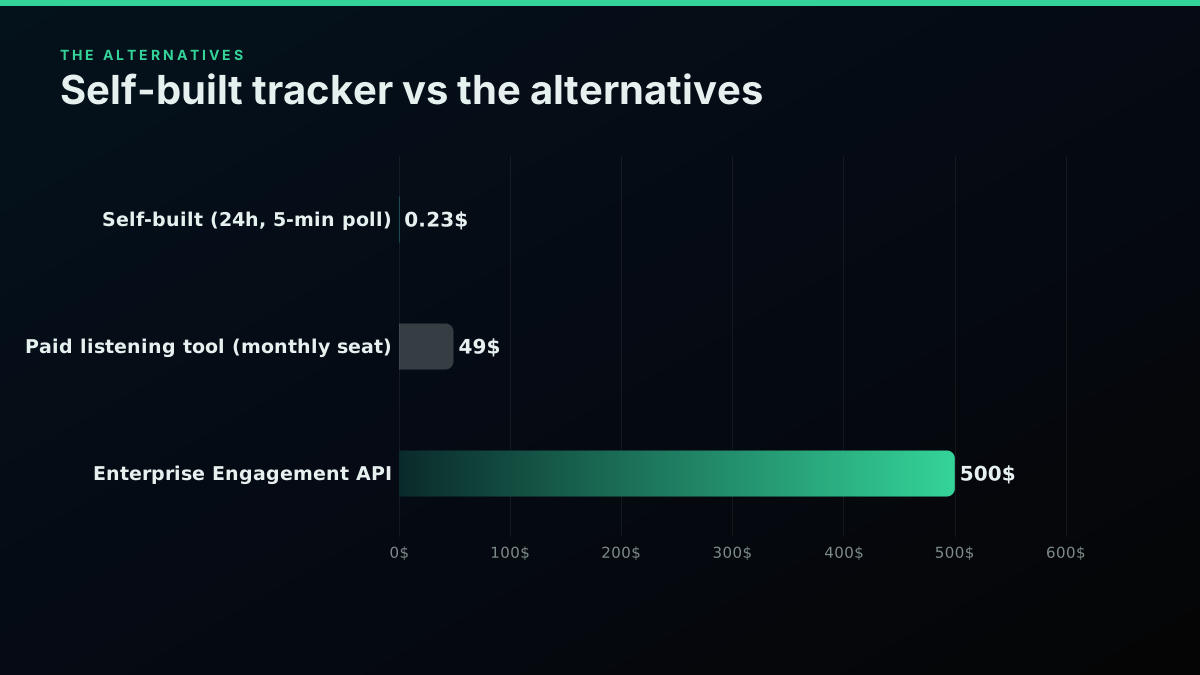
Self-built tracker vs an enterprise Engagement API contract vs a paid listening tool
Production Details That Separate a Demo From a Tracker You Can Leave Running
The loop above works as a first pass, but a script that runs unattended for a full day without silently going wrong needs more than the happy path. Five production details separate a demo you run once from a tracker you can actually leave running: how it handles a failed request, what it stores, how it timestamps, how it shares a rate limit across multiple tracked tweets, and when it decides to stop.
Back off on failure, do not just retry immediately. A single dropped request should not end the run, but hammering a failing endpoint every 5 minutes without a backoff can trip a rate limit that then blocks every subsequent poll for the rest of the window. The time.sleep(30) on an HTTPError above is deliberately simple; for a longer-running tracker, an exponential backoff (30s, then 60s, then 120s, capped) is worth the extra ten lines. The full rate limit guide and what a 429 actually means cover the response codes this backoff logic should branch on, and the error codes reference lists every status the endpoints above can return.
Store the raw response, not just the fields you think you need. A field you did not think mattered at the start (bookmark count, for example) becomes exactly the one you want three hours in. Logging the full JSON alongside the flattened CSV row costs almost nothing and saves a re-poll you cannot actually do retroactively.
Timestamp every row in UTC, not local time. A tracker that runs past midnight local time will silently corrupt any day-over-day comparison if the timestamps are not in a single, consistent zone.
Rate limits apply per key, not per tweet. If you are tracking multiple tweets in parallel from the same API key, the polling interval and the number of tweets multiply together against the same limit; stagger the polls or widen the interval rather than firing every tweet's poll at the same second.
Decide your tracking window before you start, and stop. Engagement on almost any tweet flattens out well before a week passes. A tracker with no end condition just accumulates cost and noise long after the interesting part of the curve is over; the loop above's DURATION_HOURS exists specifically so you set that boundary up front.
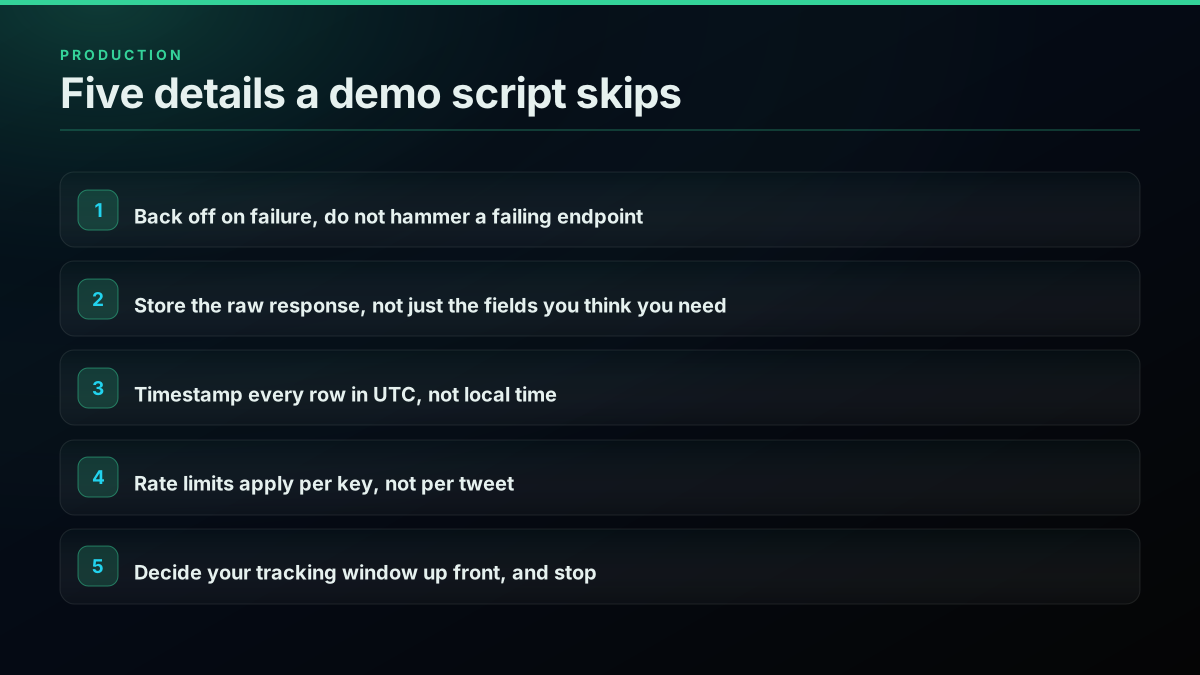
The five details that separate a demo script from a tracker you can leave running
What Mistakes Corrupt a Tracking Run?
A few specific mistakes show up repeatedly in the developer questions and open-source trackers referenced throughout this guide, and each one silently produces a wrong number rather than an obvious error, which is what makes them worth naming directly.
Treating "retweet count" as complete. The retweet field on a tweet counts classic reposts, but a quote tweet is a separate action tracked separately by quote_count. Add the two together when you want a total reshare number; report only retweet_count and you will systematically under-count reshares on any tweet that got quoted more than retweeted, which happens often on opinion-shaped or announcement tweets exactly like the launch example above. This is a genuinely common trap, not a hypothetical one:
Tweepy Retweets vs Recount_Count Different?
The developer in that thread saw a retweet_count of 24 but only pulled 19 actual retweeter user ids back, and correctly suspected the mismatch was about which reshare TYPE each field was counting, exactly the retweet-vs-quote split above. Pulling the actual retweeter list, rather than trusting the count field alone, resolves exactly this kind of discrepancy:
curl -s "https://api.twitterapis.com/twitter/tweet/retweeters?tweetId=YOUR_TWEET_ID&count=50" \
  -H "Authorization: Bearer YOUR_API_KEY"
# Returns up to 50 accounts that classic-retweeted the given tweet id, cursor-paginated.
Averaging engagement across dissimilar tweets. The StackOverflow question earlier in this guide asks for an average across a user's last 30 tweets, a reasonable instinct, but it silently assumes those 30 tweets are comparable. A pinned announcement, a reply, and a quote tweet of someone else's post all carry structurally different reach, so an average across all three tells you less than it looks like it does. Segment by tweet type (original posts vs. replies vs. quotes) before averaging, or the number will drift every time the mix of tweet types shifts.
Sampling too few quote tweets to trust the follower-distribution read. A sample of 5 or 10 quote tweets can swing wildly on a single unusual account; the 40% figure in the worked example above came from a sample of 20, and even that is a small sample by statistical standards. Pull as many as the tweet has, up to what you are willing to pay for, before treating the sub-500-follower share as a settled number rather than a directional read.
Forgetting that a tweet can be deleted or made protected mid-run. A poll against a tweet that was deleted, or whose author flipped their account to protected, returns an error rather than a zero. Handle that case explicitly (log it and stop polling that tweet) rather than letting an unhandled exception silently kill the whole tracking loop for every other tweet you might be tracking in parallel.
The cheapest pay-as-you-go Twitter API. Try it free.
$0.0008 a call, about $0.04 per 1,000 tweets at 20 tweets a page. $0.50 free credits. No credit card required.
Running the Tracker Unattended
The script above runs as a single long-lived process, which is fine for a one-off 24-hour tracking session started from a laptop or a small server. For anything you want to survive a restart or run without babysitting, two changes make it production-grade rather than a demo. First, split the single time.sleep loop into a scheduled job, a cron entry, a serverless function on a timer, or a queue worker, that runs poll_tweet() once per invocation and appends to the same log file or a database table. This means a crash or a machine restart loses at most one poll interval instead of the whole run. Second, move the CSV log to a database or an append-only object store once you are tracking more than a handful of tweets at once; a flat CSV per tweet works fine for a single launch, but the moment you want to compare growth curves across multiple tweets, a shared table keyed by tweet id and timestamp is far easier to query than a folder of separate CSV files.
Do You Need a Stream Instead of Polling?
It is worth being explicit about what this tracker is NOT: a stream. A filtered stream is built to catch every new post matching a rule the instant it happens, which is the right tool when you do not yet know which specific posts you care about, covered in the real-time mention monitoring guide. Tracking a tweet's performance is a different problem: you already have the one tweet id you care about, and you just need to sample its counters on a schedule. Polling every few minutes will not miss a meaningful shift in a known tweet's trajectory, and it avoids all of a stream's always-on connection handling, reconnect logic, and higher pricing tier. Reach for a stream only when the job changes to "find new posts I have not seen yet," not "watch this one post I already have."
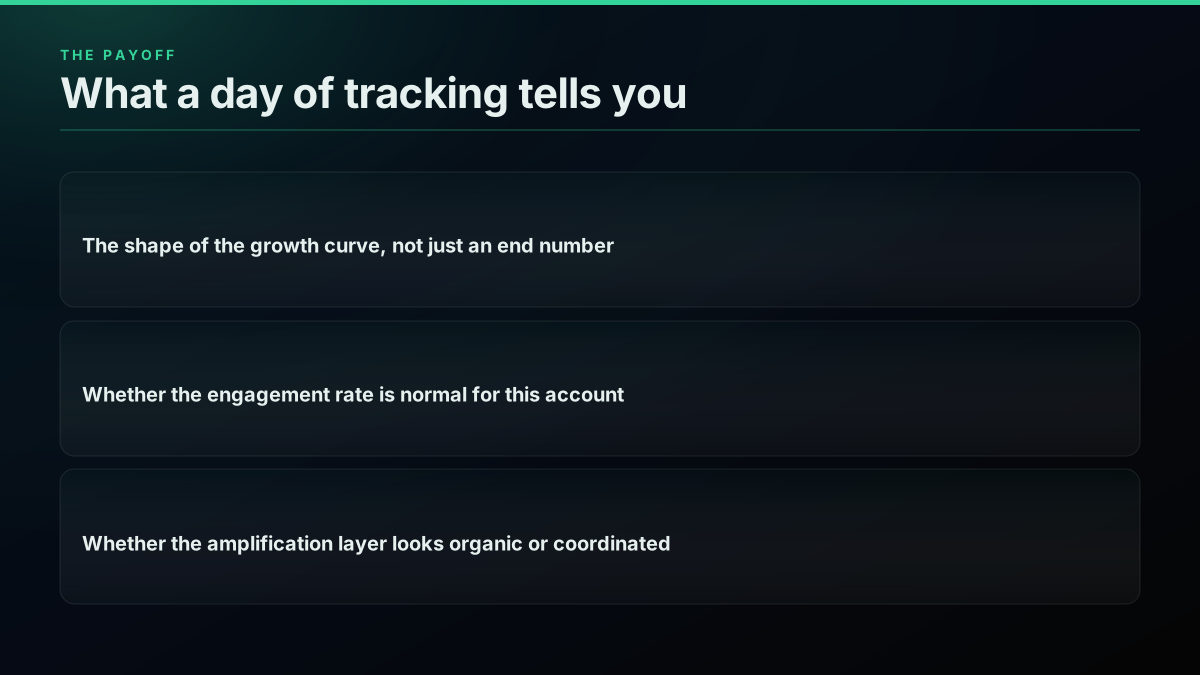
What you walk away with once the tracker has run for a day
Other Tools That Watch Twitter/X Engagement
You are not the first person to build against this problem. A public MCP server for reading Twitter/X engagement data documents the same core operation, fetching likes, retweets, replies, quotes, bookmarks, and impressions for a given tweet, wired for AI agents rather than a standalone script but built on the identical set of counts. A meme-trend tracker that ingests from both Reddit and Twitter takes the same raw-counts problem one step further, applying a weighted engagement-plus-time-decay score rather than trusting raw totals alone, the same instinct behind treating the views-to-likes ratio as a trend rather than a single number. And a solo builder's engagement tracker, put together to see which followers were engaging with their art account, ran directly into the same API limitation this guide's endpoint choice sidesteps, no direct way to list who liked or retweeted a post through the paths that project tried, describing the workaround as "dumb nonsense" glued together to get the job done. The pattern across all three: the counts are the easy part once you have a working endpoint; what you DO with the counts, decay-weighting, ratio baselines, follower distributions, is where the real signal lives.
For a broader look at reading engagement data outside a script, this walkthrough on exporting engagement data covers the manual side of the same problem:
https://www.youtube.com/watch?v=IscSsmCvlz4
The video covers the manual export path, useful context for why a scripted poll saves the repeated manual work once tracking runs past a single tweet.
Tracking Someone Else's Tweet, Not Just Your Own
Everything above works identically on a tweet you did not post. The tweet/detail, tweet/quotes, and tweet/retweeters endpoints all take a public tweet id or URL, with no requirement that the tweet belongs to the account whose Bearer token you are using. That opens the same tracker to a wider set of jobs beyond your own launch: watching how fast a competitor's announcement is spreading, checking whether a partner's mention of your product is gaining or fading, or comparing your own launch tweet's growth curve against a rival's tweet posted the same week, side by side, from the same script. The only input that changes is the tweet id you pass in, and because the read cost is the same $0.0008 either way, tracking three or four tweets in parallel costs proportionally more calls but nothing more per call. This is also the cleanest way to build a genuine before-and-after comparison for your own launches over time: keep every tracking log, tagged by launch, and a year of launch tweets becomes a real internal benchmark for what a good first-hour curve looks like for your account specifically, which is a far more useful baseline than any number pulled from someone else's audience.
Where to Go From Here
A single-tweet tracker is the smallest version of this pattern. The same polling loop, pointed at your user mentions endpoint instead of one tweet id, becomes a brand monitor. Pointed at a full account history instead of one tweet, it becomes a growth dashboard, and what else you can build with the same underlying read endpoints covers a wider set of applications than tracking alone. The advanced search operators let you scope tracking to a keyword or hashtag rather than a single known tweet id, useful for watching a launch's spread across many posts rather than just your own. If you are calling the API for the first time, the complete Twitter API tutorial and how to get an API key cover the request layer everything above sits on. If you would rather run this tracking loop from inside an AI agent or an MCP-compatible client instead of a standalone script, the MCP server exposes the same tweet detail, quotes, and retweeters calls as agent tools, and the MCP server guide covers setup end to end. And if the goal is a full account-performance view rather than one launch, how to choose a Twitter API walks through what to weigh before you commit to a provider, including how this API compares to X API v2 directly.
Sign up for $0.50 in free credit, no card required, enough to run the full tracking loop above start to finish before spending anything.
// sources
Where these numbers come from
Each row is a figure in this post and the artefact it was read from. Prices and limits on this platform move, so check the date on the source before you plan against it.
- twitterapis.com endpoint pricing
- The per-call rate this post's cost math is built on: tweet/detail, tweet/quotes, and tweet/retweeters all bill at the standard $0.0008 read rate.
- X's official rate limits documentation
- The standard read tiers most builders use instead of X's separate enterprise-tier engagement product, cited for the rate limit numbers this guide's backoff logic branches on.
- StackOverflow: How to get the total engagement on twitter
- A real, verbatim developer question showing the exact friction point (retweet and reply counts not adding up) that a tested polling loop avoids.
- lakras/twitter-engagement-tracker on GitHub
- A real open-source engagement tracker whose README documents the same official-API access friction this guide's endpoint choice works around.
- The worked-example tweet
- The real, live, public product-launch tweet whose engagement numbers and quote-tweet sample are used throughout this guide.
- r/indianstartups: automated Twitter engagement thread
- A real founder's post on automating engagement and the impressions result, cited for the reply-based growth context in the intro.
Frequently Asked Questions
Poll the tweet detail endpoint on an interval, usually every few minutes for the first few hours after it posts, and store the like, retweet, reply, quote, bookmark, and view counts each time with a timestamp. That gives you a time series instead of a single snapshot, which is what you need to see whether engagement is still climbing, flattening, or already peaked. A pay-per-call API makes this cheap: a single tweet detail call costs $0.0008, so polling one tweet every five minutes for 24 hours is 288 calls, about $0.23.
No single number proves it, but two signals together get you most of the way. First, the views-to-likes ratio: an unusually low ratio combined with a fast quote-tweet burst in the first hour is consistent with paid or coordinated amplification, because organic scroll-by views take longer to accumulate than a coordinated reply and quote wave. Second, and more reliable, is the follower-size distribution of the accounts quote-tweeting it. Pull the quote tweets, read each quoting account's follower count, and calculate what share come from very small accounts, under roughly 500 followers. A pile of near-zero-follower accounts firing quote tweets within the same narrow window is the strongest single tell of a coordinated or purchased amplification layer sitting on top of the post, whether or not the underlying content is genuinely good.
Match the interval to how fast the number moves and what it costs you to check. In the first one to two hours after a launch tweet posts, when engagement is changing the fastest, polling every 5 to 15 minutes captures the shape of the growth curve without excessive spend. After the first few hours, stretching to hourly is usually enough, since most of a tweet's lifetime engagement lands in the first day. A five-minute interval for 24 hours is 288 calls, about $0.23 at $0.0008 per call; an hourly interval for a week is 168 calls, about $0.13. Either is far cheaper than a fixed enterprise analytics contract.
X's official Engagement API is a separate, enterprise-tier product gated behind X's managed access levels; you have to go through their enterprise sales team to get access, and pricing is not self-serve. For the specific job of watching how one tweet's public counts change over time, most builders do not need it: the standard read endpoints (tweet detail, quote tweets, retweeters) that any developer can call with a Bearer token expose the same underlying counts, and a lightweight polling script built on those endpoints covers the tracking use case at pay-per-call pricing instead of an enterprise contract.
There is no single universal number, because it depends on the audience and the account, but the ratio is more useful as a consistency check than an absolute score. A tweet from an account with a broad, low-friction audience (celebrity replies, mainstream news) often runs a high views-to-likes ratio, sometimes 300:1 or more, because views accumulate from people scrolling past who never engage. A tweet from a tight, engaged niche audience often runs a much lower ratio, sometimes under 50:1. Track the ratio for your OWN account's past posts first, then use that as your baseline; a launch tweet that suddenly runs far outside your own historical range is the signal worth investigating, not a fixed threshold pulled from someone else's account.
The tweet detail endpoint returns the full current count set for one tweet: likes, retweets, replies, quotes, bookmarks, and views, along with the author's profile. On a pay-per-call API this is a single $0.0008 call per poll. To go one level deeper and see who is engaging, the quote tweets endpoint lists the tweets quoting a given tweet id, and the retweeters endpoint lists accounts that retweeted it, both also standard-rate reads.
Yes. The tweet detail, quote tweets, and retweeters endpoints all work on any public tweet id, not only tweets posted from your own account. This is what makes the technique useful beyond your own launch: tracking a competitor's announcement, a partner's mention of your product, or any public post relevant to your business works the same way. The only requirement is the numeric tweet id or the tweet's URL.
For tracking one tweet's performance, polling is not just reliable, it is the right tool. A stream is built for catching every matching post the instant it happens across a large, unpredictable set of content; tracking already knows which specific tweet id it cares about and just needs to sample its counters on a schedule. Polling every few minutes will not miss a meaningful shift in a tweet's trajectory, and it needs none of a stream's always-on connection handling or reconnect logic. Reserve streaming for the separate job of detecting NEW mentions or posts you have not seen yet, covered in the real-time mention monitoring guide linked below.
Check out similar blogs
More guides on the Twitter/X API, scraping, and pricing.
Fetch a Full Twitter Thread via API in One Call (2026)
How to pull an entire Twitter thread, the root tweet plus every connected tweet in the chain, in a single API call with the tweet/thread endpoint, instead of walking replies by hand. Live-tested code in curl, Python, and Node.js, with the real per-call cost.
Build vs Buy: Should You Build Your Own Twitter/X Monitoring Tool? (2026)
Buying a listening seat costs $29 to $2,000 a month depending on the vendor. Building costs real engineering hours plus a data bill. Here is the real math behind the twitter monitoring tool build vs buy decision, priced both ways.

How to Get Image URLs from X Tweets via API in 2026 (Full Resolution, Python and Node)
Pull image URLs out of X tweets with runnable Python and Node.js, then get the full-resolution original instead of the scaled copy the API hands you by default. Measured on 14 live images, with the video poster-frame trap and the per-call cost.
What "Rate Limited" Actually Means on X (Every Limit, Measured)
"Sorry, you are rate limited" is one message covering two different systems: a consumer action ceiling and a developer API window. Here is what the term means, the current numbers for both, where it came from, and how long it actually lasts.
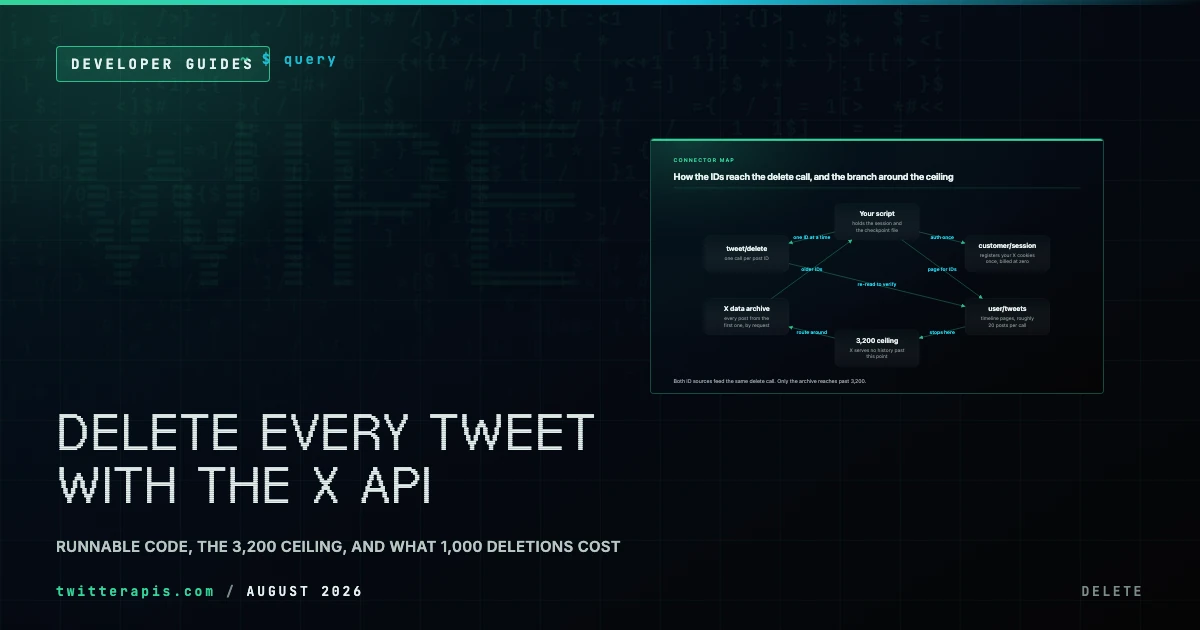
Delete All Your Tweets With the X API (2026): Runnable Code, the 3,200 Ceiling, and Real Costs
How to bulk delete tweets through an API instead of a subscription tool: the enumerate-then-delete loop in Python, X's 3,200 history ceiling, the archive-export route past it, and what 1,000 deletions actually cost.
Twitter Scraping in Python (2026): Pick a Route Before You Write Code
Four ways to collect X data in Python, priced honestly: the official X API v2 pay-per-use rate, an account-pool scraper, a headless browser, and a managed read API. What each one actually costs to run for a year.
Twitter API Authentication in 2026: OAuth, Bearer Tokens, and Fixing 401
How Twitter (X) API authentication works in 2026: the four credential types, OAuth 1.0a versus OAuth 2.0, generating and using a bearer token, runnable Python and Node.js, and a fix for every 401 Unauthorized and 403 error, plus the one-header alternative.
The Twitter API Developer Reference (2026): Endpoints, Rate Limits, Error Codes and Pagination
A single indexed reference for the Twitter/X API in 2026: the endpoint catalog, how authentication and bearer tokens work, the rate limits behind every 429, what error codes 401, 403, and 429 mean, cursor pagination, response shapes, and the real per-call cost of each call.